Tlingit-Haida vs Immigrants from Sweden Master's Degree
COMPARE
Tlingit-Haida
Immigrants from Sweden
Master's Degree
Master's Degree Comparison
Tlingit-Haida
Immigrants from Sweden
12.8%
MASTER'S DEGREE
1.3/ 100
METRIC RATING
251st/ 347
METRIC RANK
20.3%
MASTER'S DEGREE
100.0/ 100
METRIC RATING
24th/ 347
METRIC RANK
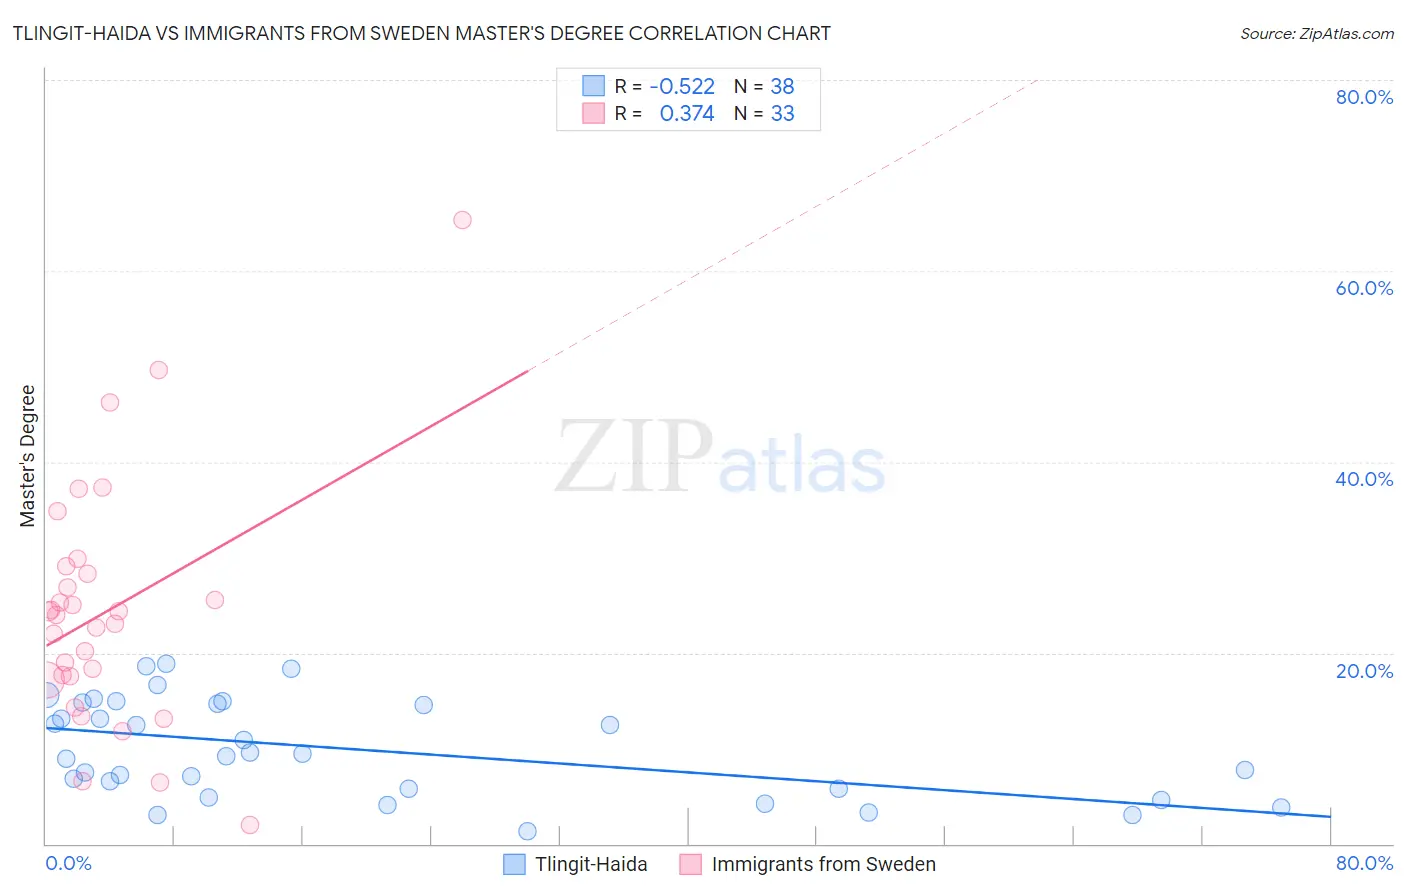
Tlingit-Haida vs Immigrants from Sweden Master's Degree Correlation Chart
The statistical analysis conducted on geographies consisting of 60,869,548 people shows a substantial negative correlation between the proportion of Tlingit-Haida and percentage of population with at least master's degree education in the United States with a correlation coefficient (R) of -0.522 and weighted average of 12.8%. Similarly, the statistical analysis conducted on geographies consisting of 164,715,920 people shows a mild positive correlation between the proportion of Immigrants from Sweden and percentage of population with at least master's degree education in the United States with a correlation coefficient (R) of 0.374 and weighted average of 20.3%, a difference of 57.9%.
Master's Degree Correlation Summary
| Measurement | Tlingit-Haida | Immigrants from Sweden |
| Minimum | 1.3% | 2.0% |
| Maximum | 18.9% | 65.4% |
| Range | 17.7% | 63.4% |
| Mean | 9.9% | 24.3% |
| Median | 9.3% | 24.0% |
| Interquartile 25% (IQ1) | 5.7% | 17.3% |
| Interquartile 75% (IQ3) | 14.7% | 28.6% |
| Interquartile Range (IQR) | 8.9% | 11.3% |
| Standard Deviation (Sample) | 5.1% | 12.7% |
| Standard Deviation (Population) | 5.0% | 12.5% |
Similar Demographics by Master's Degree
Demographics Similar to Tlingit-Haida by Master's Degree
In terms of master's degree, the demographic groups most similar to Tlingit-Haida are Liberian (12.8%, a difference of 0.030%), Cree (12.8%, a difference of 0.040%), African (12.9%, a difference of 0.35%), Iroquois (12.9%, a difference of 0.43%), and Immigrants from Cambodia (12.9%, a difference of 0.47%).
| Demographics | Rating | Rank | Master's Degree |
| Delaware | 1.7 /100 | #244 | Tragic 13.0% |
| Immigrants | Bahamas | 1.4 /100 | #245 | Tragic 12.9% |
| Immigrants | Cambodia | 1.4 /100 | #246 | Tragic 12.9% |
| Iroquois | 1.4 /100 | #247 | Tragic 12.9% |
| Africans | 1.4 /100 | #248 | Tragic 12.9% |
| Cree | 1.3 /100 | #249 | Tragic 12.8% |
| Liberians | 1.3 /100 | #250 | Tragic 12.8% |
| Tlingit-Haida | 1.3 /100 | #251 | Tragic 12.8% |
| French American Indians | 1.0 /100 | #252 | Tragic 12.7% |
| Immigrants | Dominica | 0.8 /100 | #253 | Tragic 12.6% |
| Indonesians | 0.8 /100 | #254 | Tragic 12.6% |
| Immigrants | Congo | 0.8 /100 | #255 | Tragic 12.6% |
| Immigrants | Portugal | 0.8 /100 | #256 | Tragic 12.6% |
| Osage | 0.7 /100 | #257 | Tragic 12.6% |
| Immigrants | Liberia | 0.6 /100 | #258 | Tragic 12.5% |
Demographics Similar to Immigrants from Sweden by Master's Degree
In terms of master's degree, the demographic groups most similar to Immigrants from Sweden are Immigrants from France (20.3%, a difference of 0.070%), Israeli (20.3%, a difference of 0.35%), Immigrants from Ireland (20.4%, a difference of 0.77%), Indian (Asian) (20.5%, a difference of 0.88%), and Immigrants from Hong Kong (20.5%, a difference of 0.90%).
| Demographics | Rating | Rank | Master's Degree |
| Immigrants | South Central Asia | 100.0 /100 | #17 | Exceptional 20.7% |
| Soviet Union | 100.0 /100 | #18 | Exceptional 20.5% |
| Immigrants | Hong Kong | 100.0 /100 | #19 | Exceptional 20.5% |
| Indians (Asian) | 100.0 /100 | #20 | Exceptional 20.5% |
| Immigrants | Ireland | 100.0 /100 | #21 | Exceptional 20.4% |
| Israelis | 100.0 /100 | #22 | Exceptional 20.3% |
| Immigrants | France | 100.0 /100 | #23 | Exceptional 20.3% |
| Immigrants | Sweden | 100.0 /100 | #24 | Exceptional 20.3% |
| Immigrants | Japan | 100.0 /100 | #25 | Exceptional 20.0% |
| Cambodians | 100.0 /100 | #26 | Exceptional 20.0% |
| Immigrants | Sri Lanka | 100.0 /100 | #27 | Exceptional 19.9% |
| Turks | 100.0 /100 | #28 | Exceptional 19.9% |
| Latvians | 100.0 /100 | #29 | Exceptional 19.8% |
| Immigrants | Turkey | 100.0 /100 | #30 | Exceptional 19.7% |
| Immigrants | Korea | 100.0 /100 | #31 | Exceptional 19.7% |