Cambodian vs Alaska Native Single Father Poverty
COMPARE
Cambodian
Alaska Native
Single Father Poverty
Single Father Poverty Comparison
Cambodians
Alaska Natives
16.4%
SINGLE FATHER POVERTY
34.6/ 100
METRIC RATING
184th/ 347
METRIC RANK
18.1%
SINGLE FATHER POVERTY
0.0/ 100
METRIC RATING
293rd/ 347
METRIC RANK
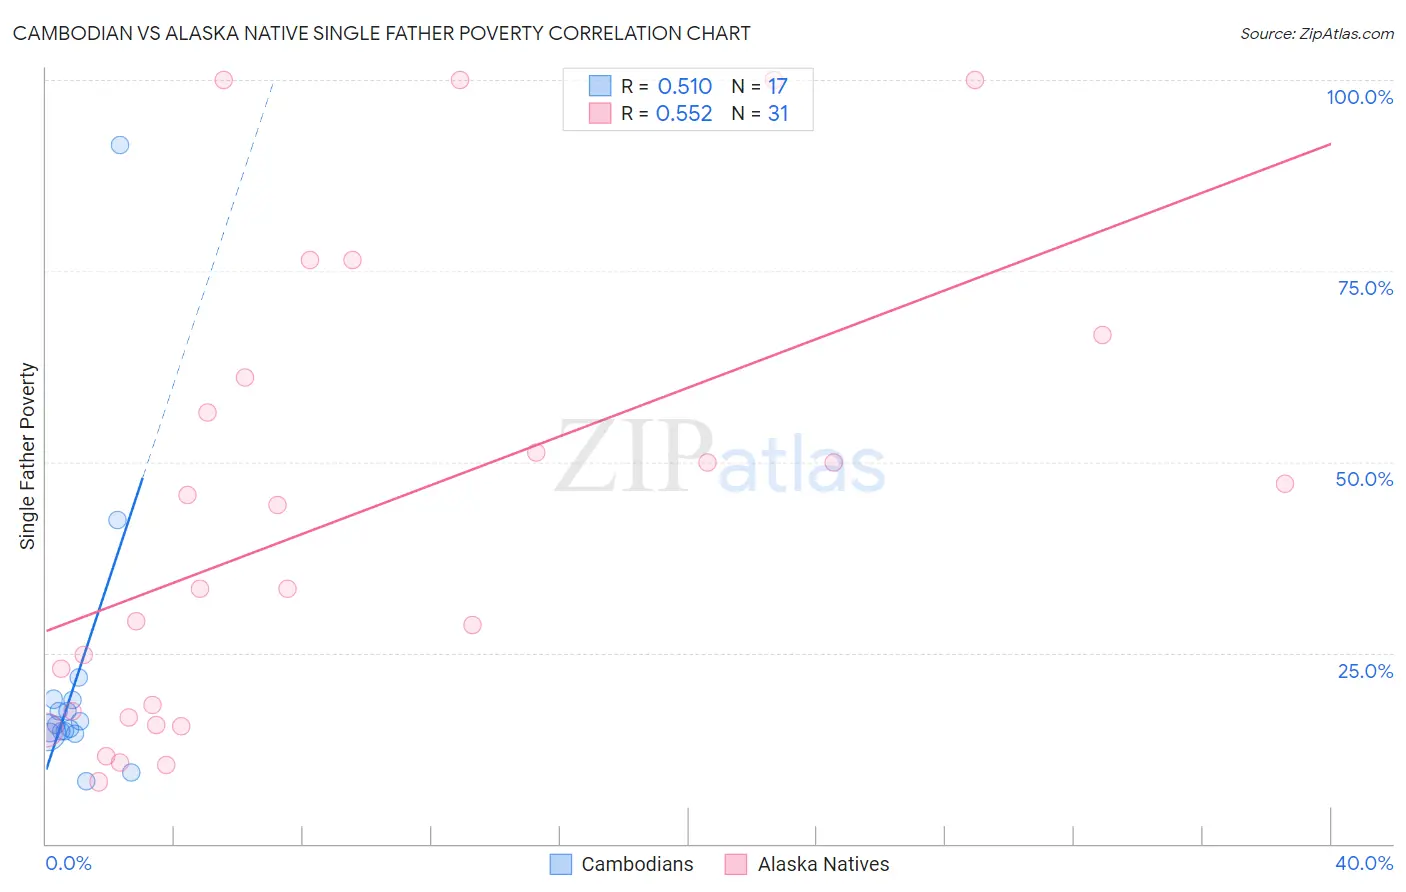
Cambodian vs Alaska Native Single Father Poverty Correlation Chart
The statistical analysis conducted on geographies consisting of 91,317,365 people shows a substantial positive correlation between the proportion of Cambodians and poverty level among single fathers in the United States with a correlation coefficient (R) of 0.510 and weighted average of 16.4%. Similarly, the statistical analysis conducted on geographies consisting of 71,846,499 people shows a substantial positive correlation between the proportion of Alaska Natives and poverty level among single fathers in the United States with a correlation coefficient (R) of 0.552 and weighted average of 18.1%, a difference of 10.3%.
Single Father Poverty Correlation Summary
| Measurement | Cambodian | Alaska Native |
| Minimum | 8.1% | 8.1% |
| Maximum | 91.5% | 100.0% |
| Range | 83.4% | 91.9% |
| Mean | 21.5% | 43.1% |
| Median | 15.6% | 33.3% |
| Interquartile 25% (IQ1) | 14.5% | 16.6% |
| Interquartile 75% (IQ3) | 18.9% | 61.0% |
| Interquartile Range (IQR) | 4.4% | 44.4% |
| Standard Deviation (Sample) | 19.5% | 29.7% |
| Standard Deviation (Population) | 18.9% | 29.2% |
Similar Demographics by Single Father Poverty
Demographics Similar to Cambodians by Single Father Poverty
In terms of single father poverty, the demographic groups most similar to Cambodians are Aleut (16.4%, a difference of 0.030%), Immigrants from Italy (16.4%, a difference of 0.050%), Panamanian (16.4%, a difference of 0.050%), Immigrants from Western Africa (16.4%, a difference of 0.060%), and Immigrants from Latin America (16.4%, a difference of 0.12%).
| Demographics | Rating | Rank | Single Father Poverty |
| Immigrants | South Africa | 44.2 /100 | #177 | Average 16.3% |
| Immigrants | Cuba | 41.6 /100 | #178 | Average 16.4% |
| Serbians | 40.9 /100 | #179 | Average 16.4% |
| Immigrants | Latin America | 37.2 /100 | #180 | Fair 16.4% |
| Immigrants | Western Africa | 36.0 /100 | #181 | Fair 16.4% |
| Immigrants | Italy | 35.7 /100 | #182 | Fair 16.4% |
| Aleuts | 35.3 /100 | #183 | Fair 16.4% |
| Cambodians | 34.6 /100 | #184 | Fair 16.4% |
| Panamanians | 33.6 /100 | #185 | Fair 16.4% |
| Immigrants | Venezuela | 31.0 /100 | #186 | Fair 16.4% |
| Ukrainians | 30.4 /100 | #187 | Fair 16.4% |
| Russians | 30.1 /100 | #188 | Fair 16.4% |
| Latvians | 28.9 /100 | #189 | Fair 16.5% |
| Immigrants | Burma/Myanmar | 28.0 /100 | #190 | Fair 16.5% |
| Immigrants | Guyana | 27.1 /100 | #191 | Fair 16.5% |
Demographics Similar to Alaska Natives by Single Father Poverty
In terms of single father poverty, the demographic groups most similar to Alaska Natives are U.S. Virgin Islander (18.1%, a difference of 0.030%), Yakama (18.1%, a difference of 0.090%), Immigrants from Bahamas (18.1%, a difference of 0.11%), Alaskan Athabascan (18.1%, a difference of 0.12%), and Seminole (18.1%, a difference of 0.19%).
| Demographics | Rating | Rank | Single Father Poverty |
| Immigrants | North Macedonia | 0.0 /100 | #286 | Tragic 17.9% |
| Carpatho Rusyns | 0.0 /100 | #287 | Tragic 18.0% |
| Bahamians | 0.0 /100 | #288 | Tragic 18.0% |
| Irish | 0.0 /100 | #289 | Tragic 18.0% |
| West Indians | 0.0 /100 | #290 | Tragic 18.0% |
| Alaskan Athabascans | 0.0 /100 | #291 | Tragic 18.1% |
| Immigrants | Bahamas | 0.0 /100 | #292 | Tragic 18.1% |
| Alaska Natives | 0.0 /100 | #293 | Tragic 18.1% |
| U.S. Virgin Islanders | 0.0 /100 | #294 | Tragic 18.1% |
| Yakama | 0.0 /100 | #295 | Tragic 18.1% |
| Seminole | 0.0 /100 | #296 | Tragic 18.1% |
| French | 0.0 /100 | #297 | Tragic 18.2% |
| Africans | 0.0 /100 | #298 | Tragic 18.3% |
| Whites/Caucasians | 0.0 /100 | #299 | Tragic 18.4% |
| Immigrants | Dominican Republic | 0.0 /100 | #300 | Tragic 18.4% |