Greek vs Alaska Native Single Father Poverty
COMPARE
Greek
Alaska Native
Single Father Poverty
Single Father Poverty Comparison
Greeks
Alaska Natives
17.1%
SINGLE FATHER POVERTY
1.3/ 100
METRIC RATING
247th/ 347
METRIC RANK
18.1%
SINGLE FATHER POVERTY
0.0/ 100
METRIC RATING
293rd/ 347
METRIC RANK
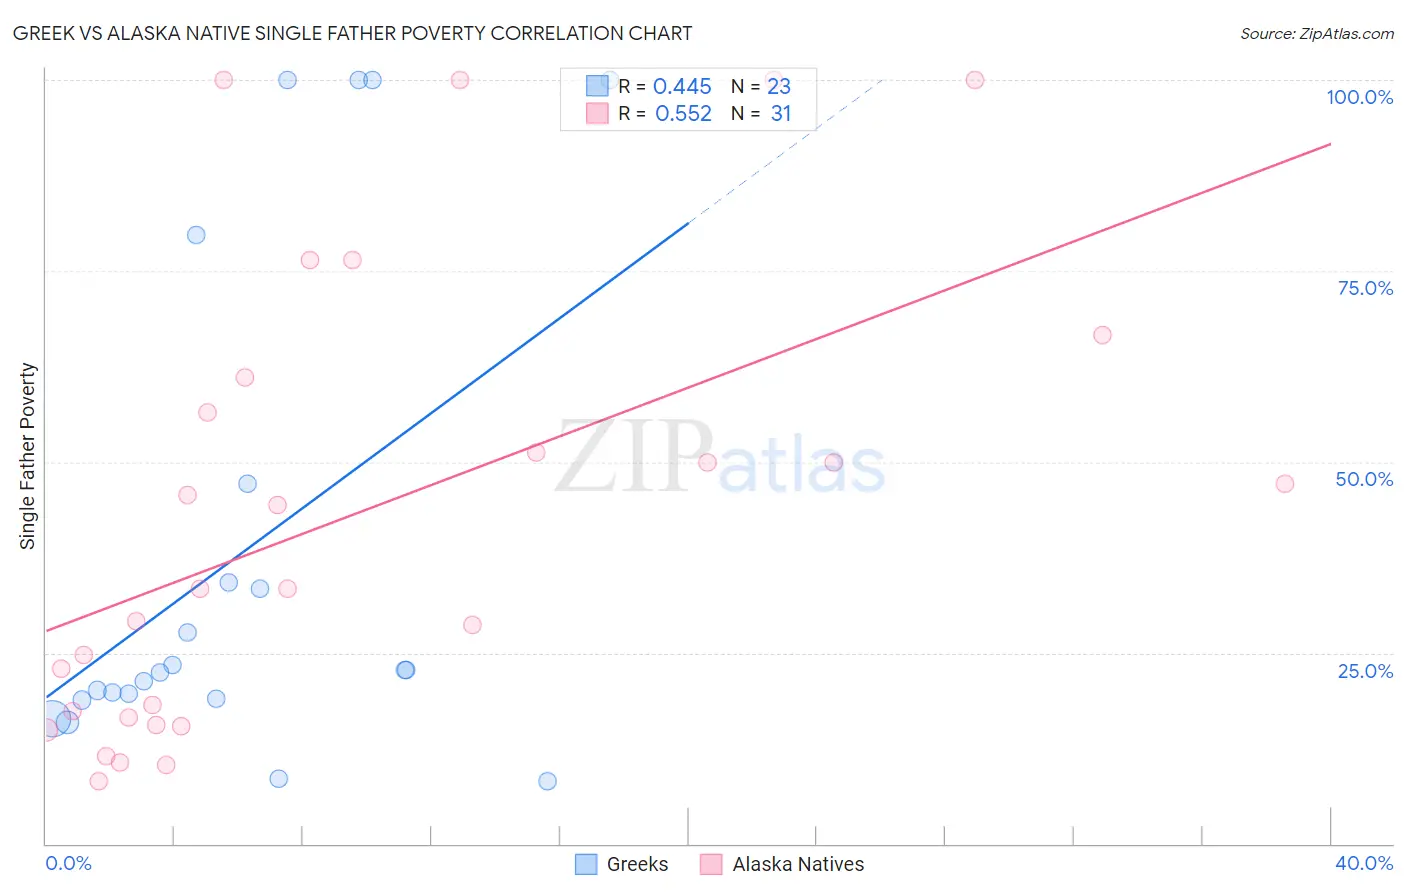
Greek vs Alaska Native Single Father Poverty Correlation Chart
The statistical analysis conducted on geographies consisting of 361,572,090 people shows a moderate positive correlation between the proportion of Greeks and poverty level among single fathers in the United States with a correlation coefficient (R) of 0.445 and weighted average of 17.1%. Similarly, the statistical analysis conducted on geographies consisting of 71,846,499 people shows a substantial positive correlation between the proportion of Alaska Natives and poverty level among single fathers in the United States with a correlation coefficient (R) of 0.552 and weighted average of 18.1%, a difference of 6.1%.
Single Father Poverty Correlation Summary
| Measurement | Greek | Alaska Native |
| Minimum | 8.2% | 8.1% |
| Maximum | 100.0% | 100.0% |
| Range | 91.8% | 91.9% |
| Mean | 38.3% | 43.1% |
| Median | 22.7% | 33.3% |
| Interquartile 25% (IQ1) | 19.0% | 16.6% |
| Interquartile 75% (IQ3) | 47.2% | 61.0% |
| Interquartile Range (IQR) | 28.2% | 44.4% |
| Standard Deviation (Sample) | 32.3% | 29.7% |
| Standard Deviation (Population) | 31.6% | 29.2% |
Similar Demographics by Single Father Poverty
Demographics Similar to Greeks by Single Father Poverty
In terms of single father poverty, the demographic groups most similar to Greeks are Czechoslovakian (17.1%, a difference of 0.0%), Canadian (17.1%, a difference of 0.050%), Immigrants from Ireland (17.1%, a difference of 0.10%), Trinidadian and Tobagonian (17.0%, a difference of 0.14%), and Honduran (17.0%, a difference of 0.18%).
| Demographics | Rating | Rank | Single Father Poverty |
| Finns | 2.6 /100 | #240 | Tragic 16.9% |
| Czechs | 2.3 /100 | #241 | Tragic 17.0% |
| Moroccans | 2.1 /100 | #242 | Tragic 17.0% |
| Immigrants | Cabo Verde | 1.6 /100 | #243 | Tragic 17.0% |
| Hondurans | 1.6 /100 | #244 | Tragic 17.0% |
| Trinidadians and Tobagonians | 1.5 /100 | #245 | Tragic 17.0% |
| Immigrants | Ireland | 1.4 /100 | #246 | Tragic 17.1% |
| Greeks | 1.3 /100 | #247 | Tragic 17.1% |
| Czechoslovakians | 1.3 /100 | #248 | Tragic 17.1% |
| Canadians | 1.3 /100 | #249 | Tragic 17.1% |
| Austrians | 1.1 /100 | #250 | Tragic 17.1% |
| Luxembourgers | 1.1 /100 | #251 | Tragic 17.1% |
| Croatians | 1.0 /100 | #252 | Tragic 17.1% |
| Cree | 1.0 /100 | #253 | Tragic 17.1% |
| Immigrants | Honduras | 0.9 /100 | #254 | Tragic 17.1% |
Demographics Similar to Alaska Natives by Single Father Poverty
In terms of single father poverty, the demographic groups most similar to Alaska Natives are U.S. Virgin Islander (18.1%, a difference of 0.030%), Yakama (18.1%, a difference of 0.090%), Immigrants from Bahamas (18.1%, a difference of 0.11%), Alaskan Athabascan (18.1%, a difference of 0.12%), and Seminole (18.1%, a difference of 0.19%).
| Demographics | Rating | Rank | Single Father Poverty |
| Immigrants | North Macedonia | 0.0 /100 | #286 | Tragic 17.9% |
| Carpatho Rusyns | 0.0 /100 | #287 | Tragic 18.0% |
| Bahamians | 0.0 /100 | #288 | Tragic 18.0% |
| Irish | 0.0 /100 | #289 | Tragic 18.0% |
| West Indians | 0.0 /100 | #290 | Tragic 18.0% |
| Alaskan Athabascans | 0.0 /100 | #291 | Tragic 18.1% |
| Immigrants | Bahamas | 0.0 /100 | #292 | Tragic 18.1% |
| Alaska Natives | 0.0 /100 | #293 | Tragic 18.1% |
| U.S. Virgin Islanders | 0.0 /100 | #294 | Tragic 18.1% |
| Yakama | 0.0 /100 | #295 | Tragic 18.1% |
| Seminole | 0.0 /100 | #296 | Tragic 18.1% |
| French | 0.0 /100 | #297 | Tragic 18.2% |
| Africans | 0.0 /100 | #298 | Tragic 18.3% |
| Whites/Caucasians | 0.0 /100 | #299 | Tragic 18.4% |
| Immigrants | Dominican Republic | 0.0 /100 | #300 | Tragic 18.4% |