Cajun vs Alaska Native Single Father Poverty
COMPARE
Cajun
Alaska Native
Single Father Poverty
Single Father Poverty Comparison
Cajuns
Alaska Natives
23.1%
SINGLE FATHER POVERTY
0.0/ 100
METRIC RATING
336th/ 347
METRIC RANK
18.1%
SINGLE FATHER POVERTY
0.0/ 100
METRIC RATING
293rd/ 347
METRIC RANK
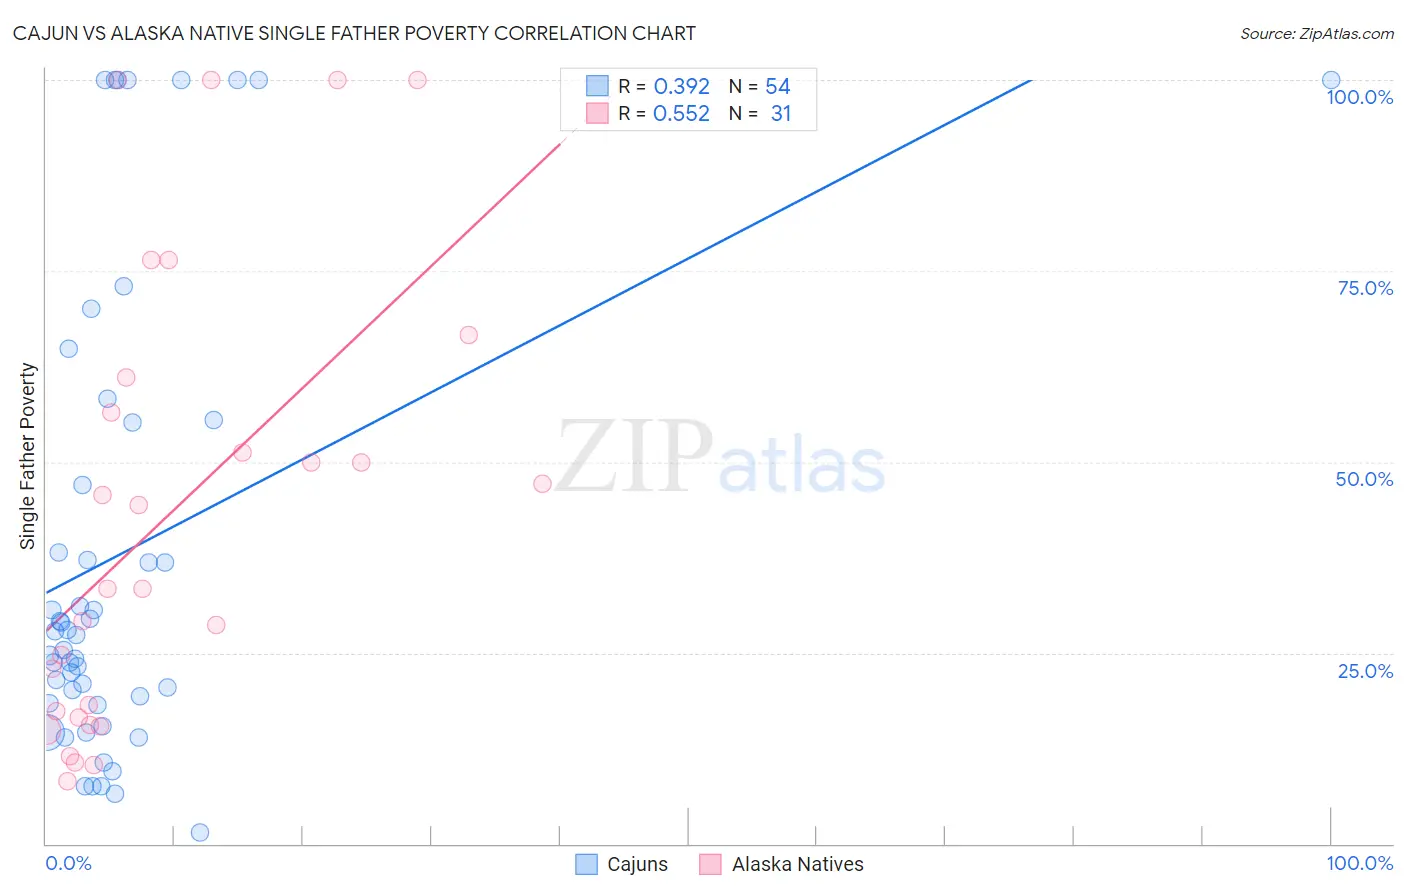
Cajun vs Alaska Native Single Father Poverty Correlation Chart
The statistical analysis conducted on geographies consisting of 130,032,102 people shows a mild positive correlation between the proportion of Cajuns and poverty level among single fathers in the United States with a correlation coefficient (R) of 0.392 and weighted average of 23.1%. Similarly, the statistical analysis conducted on geographies consisting of 71,846,499 people shows a substantial positive correlation between the proportion of Alaska Natives and poverty level among single fathers in the United States with a correlation coefficient (R) of 0.552 and weighted average of 18.1%, a difference of 27.4%.
Single Father Poverty Correlation Summary
| Measurement | Cajun | Alaska Native |
| Minimum | 1.4% | 8.1% |
| Maximum | 100.0% | 100.0% |
| Range | 98.6% | 91.9% |
| Mean | 38.2% | 43.1% |
| Median | 27.6% | 33.3% |
| Interquartile 25% (IQ1) | 18.4% | 16.6% |
| Interquartile 75% (IQ3) | 55.1% | 61.0% |
| Interquartile Range (IQR) | 36.7% | 44.4% |
| Standard Deviation (Sample) | 30.3% | 29.7% |
| Standard Deviation (Population) | 30.0% | 29.2% |
Similar Demographics by Single Father Poverty
Demographics Similar to Cajuns by Single Father Poverty
In terms of single father poverty, the demographic groups most similar to Cajuns are Shoshone (22.9%, a difference of 0.71%), Kiowa (22.5%, a difference of 2.7%), Native/Alaskan (22.4%, a difference of 3.0%), Sioux (23.9%, a difference of 3.5%), and Arapaho (24.0%, a difference of 3.9%).
| Demographics | Rating | Rank | Single Father Poverty |
| Colville | 0.0 /100 | #329 | Tragic 21.4% |
| Paiute | 0.0 /100 | #330 | Tragic 21.6% |
| Central American Indians | 0.0 /100 | #331 | Tragic 21.7% |
| Tohono O'odham | 0.0 /100 | #332 | Tragic 22.0% |
| Natives/Alaskans | 0.0 /100 | #333 | Tragic 22.4% |
| Kiowa | 0.0 /100 | #334 | Tragic 22.5% |
| Shoshone | 0.0 /100 | #335 | Tragic 22.9% |
| Cajuns | 0.0 /100 | #336 | Tragic 23.1% |
| Sioux | 0.0 /100 | #337 | Tragic 23.9% |
| Arapaho | 0.0 /100 | #338 | Tragic 24.0% |
| Apache | 0.0 /100 | #339 | Tragic 24.2% |
| Houma | 0.0 /100 | #340 | Tragic 26.7% |
| Hopi | 0.0 /100 | #341 | Tragic 27.2% |
| Yuman | 0.0 /100 | #342 | Tragic 28.4% |
| Lumbee | 0.0 /100 | #343 | Tragic 28.5% |
Demographics Similar to Alaska Natives by Single Father Poverty
In terms of single father poverty, the demographic groups most similar to Alaska Natives are U.S. Virgin Islander (18.1%, a difference of 0.030%), Yakama (18.1%, a difference of 0.090%), Immigrants from Bahamas (18.1%, a difference of 0.11%), Alaskan Athabascan (18.1%, a difference of 0.12%), and Seminole (18.1%, a difference of 0.19%).
| Demographics | Rating | Rank | Single Father Poverty |
| Immigrants | North Macedonia | 0.0 /100 | #286 | Tragic 17.9% |
| Carpatho Rusyns | 0.0 /100 | #287 | Tragic 18.0% |
| Bahamians | 0.0 /100 | #288 | Tragic 18.0% |
| Irish | 0.0 /100 | #289 | Tragic 18.0% |
| West Indians | 0.0 /100 | #290 | Tragic 18.0% |
| Alaskan Athabascans | 0.0 /100 | #291 | Tragic 18.1% |
| Immigrants | Bahamas | 0.0 /100 | #292 | Tragic 18.1% |
| Alaska Natives | 0.0 /100 | #293 | Tragic 18.1% |
| U.S. Virgin Islanders | 0.0 /100 | #294 | Tragic 18.1% |
| Yakama | 0.0 /100 | #295 | Tragic 18.1% |
| Seminole | 0.0 /100 | #296 | Tragic 18.1% |
| French | 0.0 /100 | #297 | Tragic 18.2% |
| Africans | 0.0 /100 | #298 | Tragic 18.3% |
| Whites/Caucasians | 0.0 /100 | #299 | Tragic 18.4% |
| Immigrants | Dominican Republic | 0.0 /100 | #300 | Tragic 18.4% |