Barbadian vs Alaska Native Single Father Poverty
COMPARE
Barbadian
Alaska Native
Single Father Poverty
Single Father Poverty Comparison
Barbadians
Alaska Natives
17.5%
SINGLE FATHER POVERTY
0.1/ 100
METRIC RATING
272nd/ 347
METRIC RANK
18.1%
SINGLE FATHER POVERTY
0.0/ 100
METRIC RATING
293rd/ 347
METRIC RANK
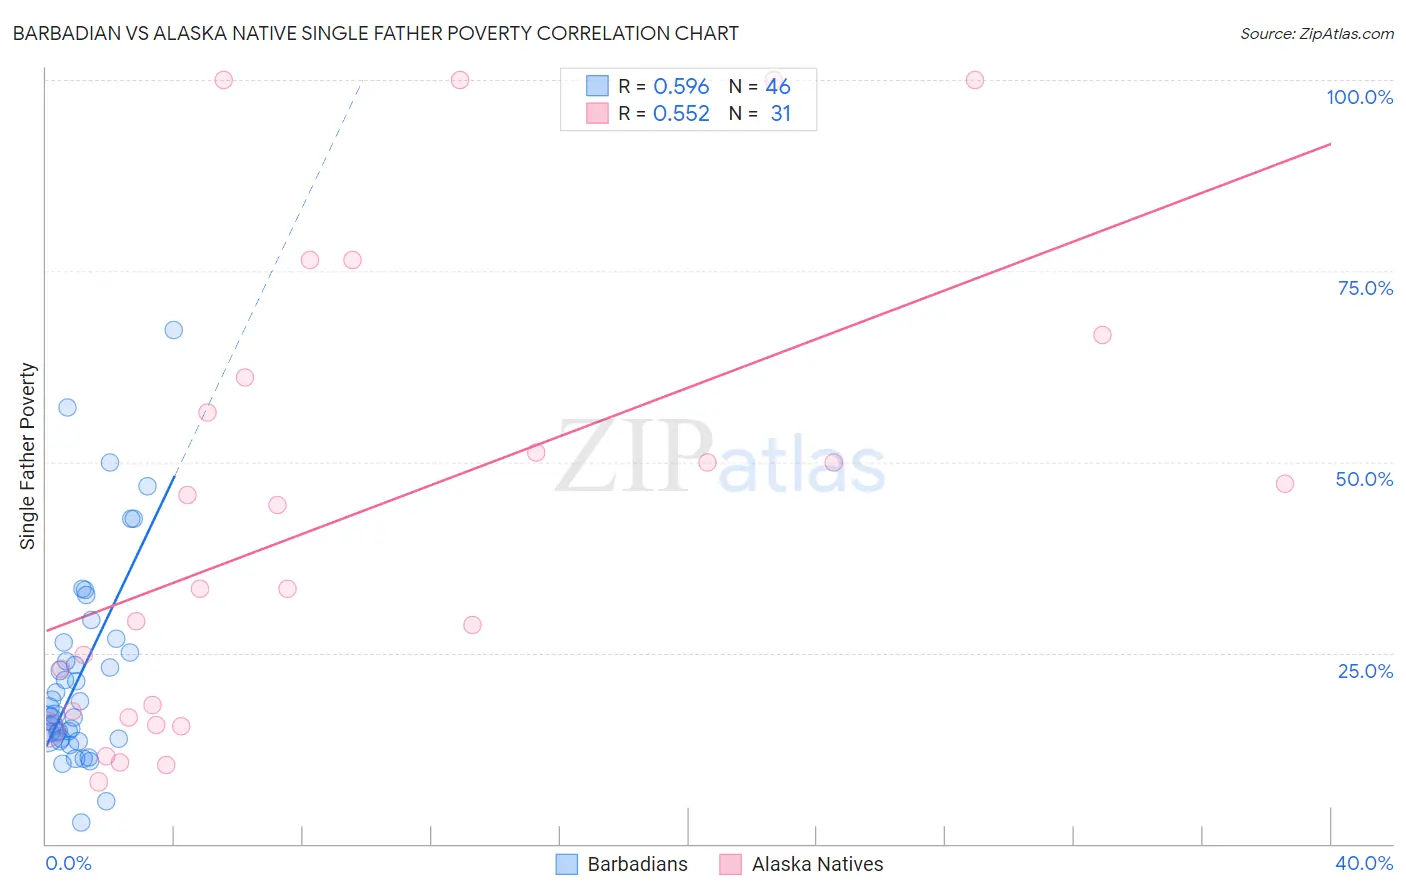
Barbadian vs Alaska Native Single Father Poverty Correlation Chart
The statistical analysis conducted on geographies consisting of 128,228,135 people shows a substantial positive correlation between the proportion of Barbadians and poverty level among single fathers in the United States with a correlation coefficient (R) of 0.596 and weighted average of 17.5%. Similarly, the statistical analysis conducted on geographies consisting of 71,846,499 people shows a substantial positive correlation between the proportion of Alaska Natives and poverty level among single fathers in the United States with a correlation coefficient (R) of 0.552 and weighted average of 18.1%, a difference of 3.5%.
Single Father Poverty Correlation Summary
| Measurement | Barbadian | Alaska Native |
| Minimum | 2.8% | 8.1% |
| Maximum | 67.2% | 100.0% |
| Range | 64.4% | 91.9% |
| Mean | 22.3% | 43.1% |
| Median | 17.4% | 33.3% |
| Interquartile 25% (IQ1) | 13.7% | 16.6% |
| Interquartile 75% (IQ3) | 26.3% | 61.0% |
| Interquartile Range (IQR) | 12.6% | 44.4% |
| Standard Deviation (Sample) | 13.4% | 29.7% |
| Standard Deviation (Population) | 13.3% | 29.2% |
Similar Demographics by Single Father Poverty
Demographics Similar to Barbadians by Single Father Poverty
In terms of single father poverty, the demographic groups most similar to Barbadians are Italian (17.5%, a difference of 0.28%), French American Indian (17.4%, a difference of 0.35%), Indonesian (17.4%, a difference of 0.48%), Slavic (17.4%, a difference of 0.74%), and Immigrants from Caribbean (17.4%, a difference of 0.81%).
| Demographics | Rating | Rank | Single Father Poverty |
| Poles | 0.3 /100 | #265 | Tragic 17.3% |
| Jamaicans | 0.3 /100 | #266 | Tragic 17.3% |
| Haitians | 0.3 /100 | #267 | Tragic 17.3% |
| Immigrants | Caribbean | 0.3 /100 | #268 | Tragic 17.4% |
| Slavs | 0.3 /100 | #269 | Tragic 17.4% |
| Indonesians | 0.2 /100 | #270 | Tragic 17.4% |
| French American Indians | 0.2 /100 | #271 | Tragic 17.4% |
| Barbadians | 0.1 /100 | #272 | Tragic 17.5% |
| Italians | 0.1 /100 | #273 | Tragic 17.5% |
| Macedonians | 0.1 /100 | #274 | Tragic 17.7% |
| British West Indians | 0.0 /100 | #275 | Tragic 17.7% |
| German Russians | 0.0 /100 | #276 | Tragic 17.7% |
| Lebanese | 0.0 /100 | #277 | Tragic 17.7% |
| Germans | 0.0 /100 | #278 | Tragic 17.7% |
| Iroquois | 0.0 /100 | #279 | Tragic 17.7% |
Demographics Similar to Alaska Natives by Single Father Poverty
In terms of single father poverty, the demographic groups most similar to Alaska Natives are U.S. Virgin Islander (18.1%, a difference of 0.030%), Yakama (18.1%, a difference of 0.090%), Immigrants from Bahamas (18.1%, a difference of 0.11%), Alaskan Athabascan (18.1%, a difference of 0.12%), and Seminole (18.1%, a difference of 0.19%).
| Demographics | Rating | Rank | Single Father Poverty |
| Immigrants | North Macedonia | 0.0 /100 | #286 | Tragic 17.9% |
| Carpatho Rusyns | 0.0 /100 | #287 | Tragic 18.0% |
| Bahamians | 0.0 /100 | #288 | Tragic 18.0% |
| Irish | 0.0 /100 | #289 | Tragic 18.0% |
| West Indians | 0.0 /100 | #290 | Tragic 18.0% |
| Alaskan Athabascans | 0.0 /100 | #291 | Tragic 18.1% |
| Immigrants | Bahamas | 0.0 /100 | #292 | Tragic 18.1% |
| Alaska Natives | 0.0 /100 | #293 | Tragic 18.1% |
| U.S. Virgin Islanders | 0.0 /100 | #294 | Tragic 18.1% |
| Yakama | 0.0 /100 | #295 | Tragic 18.1% |
| Seminole | 0.0 /100 | #296 | Tragic 18.1% |
| French | 0.0 /100 | #297 | Tragic 18.2% |
| Africans | 0.0 /100 | #298 | Tragic 18.3% |
| Whites/Caucasians | 0.0 /100 | #299 | Tragic 18.4% |
| Immigrants | Dominican Republic | 0.0 /100 | #300 | Tragic 18.4% |