Cherokee vs African Family Poverty
COMPARE
Cherokee
African
Family Poverty
Family Poverty Comparison
Cherokee
Africans
10.6%
FAMILY POVERTY
0.5/ 100
METRIC RATING
246th/ 347
METRIC RANK
11.8%
FAMILY POVERTY
0.0/ 100
METRIC RATING
303rd/ 347
METRIC RANK
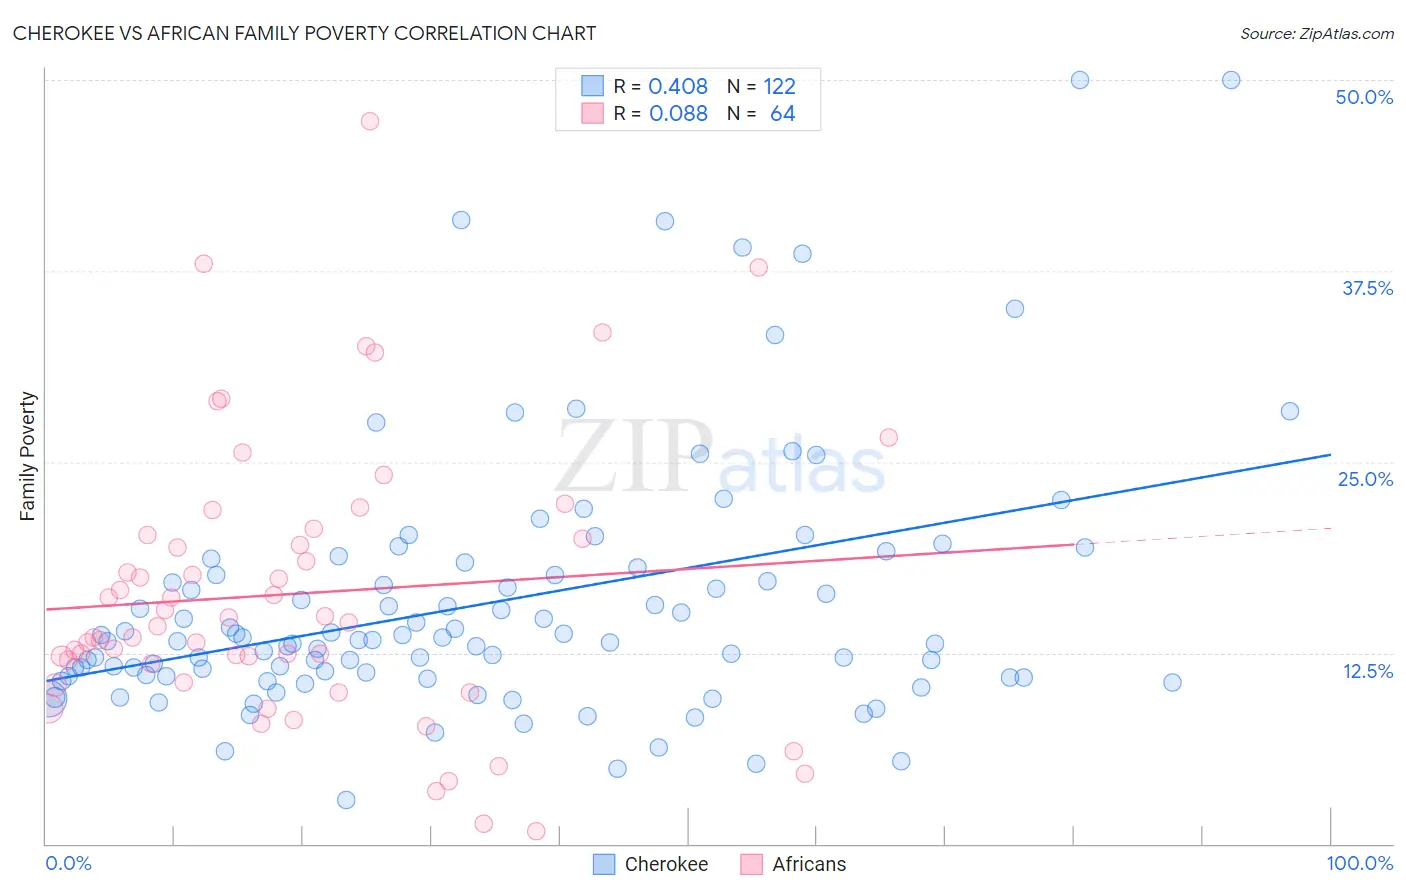
Cherokee vs African Family Poverty Correlation Chart
The statistical analysis conducted on geographies consisting of 492,113,161 people shows a moderate positive correlation between the proportion of Cherokee and poverty level among families in the United States with a correlation coefficient (R) of 0.408 and weighted average of 10.6%. Similarly, the statistical analysis conducted on geographies consisting of 468,652,941 people shows a slight positive correlation between the proportion of Africans and poverty level among families in the United States with a correlation coefficient (R) of 0.088 and weighted average of 11.8%, a difference of 11.1%.
Family Poverty Correlation Summary
| Measurement | Cherokee | African |
| Minimum | 2.9% | 0.78% |
| Maximum | 50.0% | 47.3% |
| Range | 47.1% | 46.5% |
| Mean | 15.7% | 16.4% |
| Median | 13.3% | 14.4% |
| Interquartile 25% (IQ1) | 10.9% | 11.2% |
| Interquartile 75% (IQ3) | 17.6% | 20.1% |
| Interquartile Range (IQR) | 6.7% | 9.0% |
| Standard Deviation (Sample) | 8.5% | 9.2% |
| Standard Deviation (Population) | 8.4% | 9.1% |
Similar Demographics by Family Poverty
Demographics Similar to Cherokee by Family Poverty
In terms of family poverty, the demographic groups most similar to Cherokee are Liberian (10.6%, a difference of 0.090%), Nicaraguan (10.6%, a difference of 0.29%), Cuban (10.6%, a difference of 0.34%), Immigrants from Burma/Myanmar (10.5%, a difference of 0.64%), and Salvadoran (10.7%, a difference of 0.87%).
| Demographics | Rating | Rank | Family Poverty |
| Potawatomi | 1.5 /100 | #239 | Tragic 10.2% |
| Immigrants | Azores | 1.4 /100 | #240 | Tragic 10.3% |
| Ghanaians | 1.3 /100 | #241 | Tragic 10.3% |
| Alaska Natives | 1.0 /100 | #242 | Tragic 10.4% |
| Nepalese | 0.8 /100 | #243 | Tragic 10.4% |
| Cree | 0.7 /100 | #244 | Tragic 10.5% |
| Immigrants | Burma/Myanmar | 0.6 /100 | #245 | Tragic 10.5% |
| Cherokee | 0.5 /100 | #246 | Tragic 10.6% |
| Liberians | 0.4 /100 | #247 | Tragic 10.6% |
| Nicaraguans | 0.4 /100 | #248 | Tragic 10.6% |
| Cubans | 0.4 /100 | #249 | Tragic 10.6% |
| Salvadorans | 0.3 /100 | #250 | Tragic 10.7% |
| Iroquois | 0.3 /100 | #251 | Tragic 10.7% |
| Immigrants | Zaire | 0.3 /100 | #252 | Tragic 10.7% |
| Immigrants | Western Africa | 0.3 /100 | #253 | Tragic 10.7% |
Demographics Similar to Africans by Family Poverty
In terms of family poverty, the demographic groups most similar to Africans are Immigrants from Latin America (11.8%, a difference of 0.19%), Mexican (11.8%, a difference of 0.37%), Guatemalan (11.7%, a difference of 0.50%), Bahamian (11.7%, a difference of 0.54%), and Immigrants from Bangladesh (11.7%, a difference of 0.80%).
| Demographics | Rating | Rank | Family Poverty |
| Choctaw | 0.0 /100 | #296 | Tragic 11.6% |
| Creek | 0.0 /100 | #297 | Tragic 11.7% |
| Immigrants | Senegal | 0.0 /100 | #298 | Tragic 11.7% |
| Dutch West Indians | 0.0 /100 | #299 | Tragic 11.7% |
| Immigrants | Bangladesh | 0.0 /100 | #300 | Tragic 11.7% |
| Bahamians | 0.0 /100 | #301 | Tragic 11.7% |
| Guatemalans | 0.0 /100 | #302 | Tragic 11.7% |
| Africans | 0.0 /100 | #303 | Tragic 11.8% |
| Immigrants | Latin America | 0.0 /100 | #304 | Tragic 11.8% |
| Mexicans | 0.0 /100 | #305 | Tragic 11.8% |
| Cajuns | 0.0 /100 | #306 | Tragic 11.9% |
| Immigrants | Congo | 0.0 /100 | #307 | Tragic 11.9% |
| Seminole | 0.0 /100 | #308 | Tragic 11.9% |
| Hispanics or Latinos | 0.0 /100 | #309 | Tragic 12.0% |
| Immigrants | Guatemala | 0.0 /100 | #310 | Tragic 12.0% |