Tlingit-Haida vs African In Labor Force | Age > 16
COMPARE
Tlingit-Haida
African
In Labor Force | Age > 16
In Labor Force | Age > 16 Comparison
Tlingit-Haida
Africans
65.5%
IN LABOR FORCE | AGE > 16
88.3/ 100
METRIC RATING
145th/ 347
METRIC RANK
64.6%
IN LABOR FORCE | AGE > 16
5.8/ 100
METRIC RATING
232nd/ 347
METRIC RANK
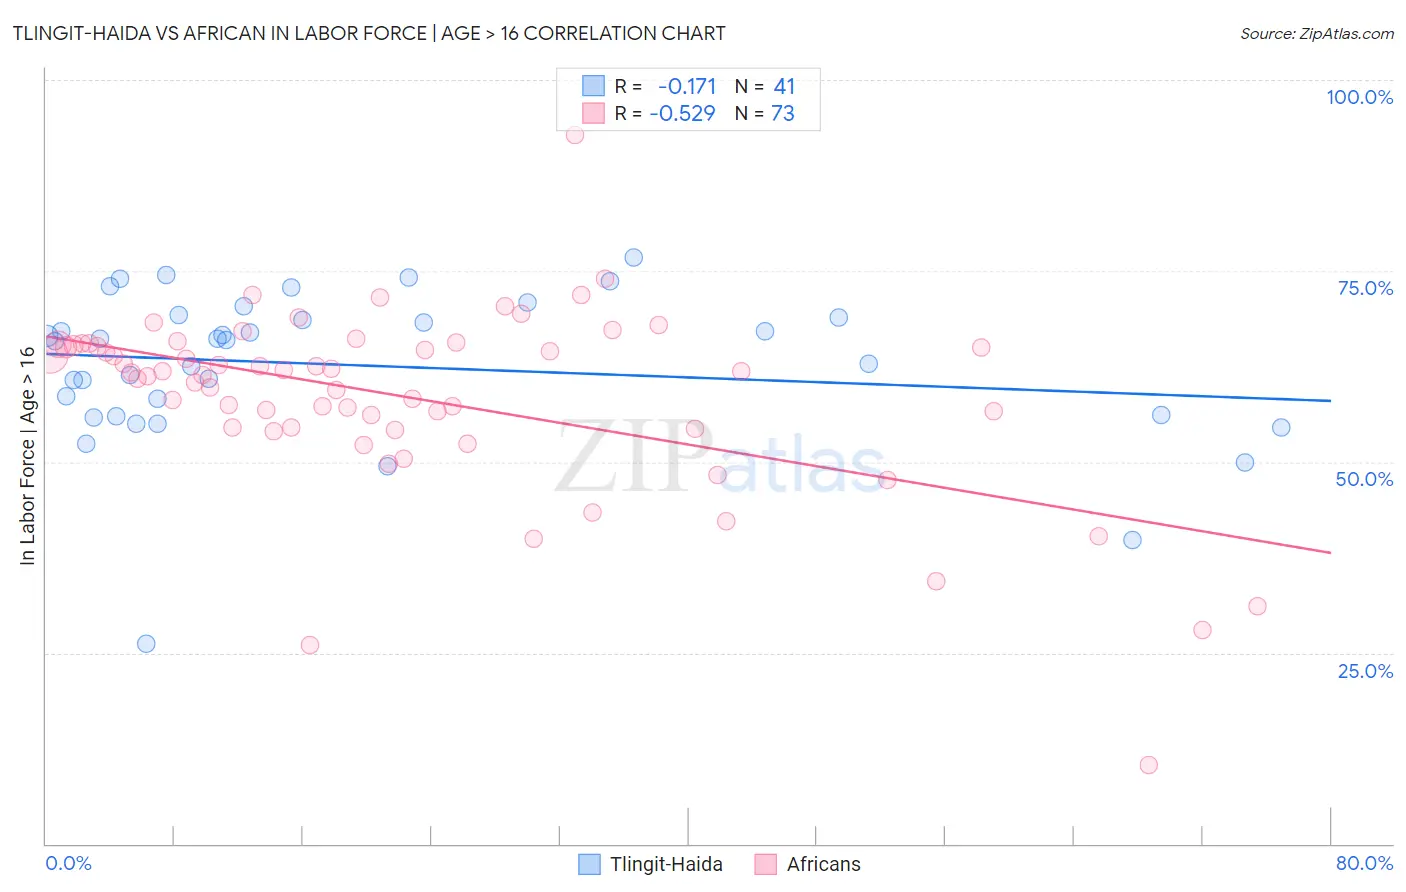
Tlingit-Haida vs African In Labor Force | Age > 16 Correlation Chart
The statistical analysis conducted on geographies consisting of 60,871,082 people shows a poor negative correlation between the proportion of Tlingit-Haida and labor force participation rate among population ages 16 and over in the United States with a correlation coefficient (R) of -0.171 and weighted average of 65.5%. Similarly, the statistical analysis conducted on geographies consisting of 470,091,127 people shows a substantial negative correlation between the proportion of Africans and labor force participation rate among population ages 16 and over in the United States with a correlation coefficient (R) of -0.529 and weighted average of 64.6%, a difference of 1.4%.
In Labor Force | Age > 16 Correlation Summary
| Measurement | Tlingit-Haida | African |
| Minimum | 26.2% | 10.3% |
| Maximum | 76.7% | 92.8% |
| Range | 50.5% | 82.5% |
| Mean | 62.7% | 58.4% |
| Median | 66.0% | 61.6% |
| Interquartile 25% (IQ1) | 56.0% | 54.4% |
| Interquartile 75% (IQ3) | 69.1% | 65.3% |
| Interquartile Range (IQR) | 13.1% | 10.9% |
| Standard Deviation (Sample) | 10.0% | 12.3% |
| Standard Deviation (Population) | 9.9% | 12.2% |
Similar Demographics by In Labor Force | Age > 16
Demographics Similar to Tlingit-Haida by In Labor Force | Age > 16
In terms of in labor force | age > 16, the demographic groups most similar to Tlingit-Haida are Cypriot (65.5%, a difference of 0.0%), Immigrants from Romania (65.5%, a difference of 0.010%), Immigrants from Oceania (65.5%, a difference of 0.020%), Indian (Asian) (65.5%, a difference of 0.030%), and Latvian (65.5%, a difference of 0.030%).
| Demographics | Rating | Rank | In Labor Force | Age > 16 |
| Immigrants | West Indies | 92.0 /100 | #138 | Exceptional 65.6% |
| Immigrants | Taiwan | 90.8 /100 | #139 | Exceptional 65.5% |
| Immigrants | Costa Rica | 90.8 /100 | #140 | Exceptional 65.5% |
| Samoans | 90.5 /100 | #141 | Exceptional 65.5% |
| Indians (Asian) | 89.5 /100 | #142 | Excellent 65.5% |
| Latvians | 89.4 /100 | #143 | Excellent 65.5% |
| Immigrants | Romania | 88.6 /100 | #144 | Excellent 65.5% |
| Tlingit-Haida | 88.3 /100 | #145 | Excellent 65.5% |
| Cypriots | 88.2 /100 | #146 | Excellent 65.5% |
| Immigrants | Oceania | 87.5 /100 | #147 | Excellent 65.5% |
| Bhutanese | 86.3 /100 | #148 | Excellent 65.5% |
| Immigrants | Albania | 85.7 /100 | #149 | Excellent 65.4% |
| Immigrants | Immigrants | 81.9 /100 | #150 | Excellent 65.4% |
| Czechs | 81.5 /100 | #151 | Excellent 65.4% |
| Yugoslavians | 81.3 /100 | #152 | Excellent 65.4% |
Demographics Similar to Africans by In Labor Force | Age > 16
In terms of in labor force | age > 16, the demographic groups most similar to Africans are Slavic (64.6%, a difference of 0.050%), Vietnamese (64.6%, a difference of 0.060%), Austrian (64.6%, a difference of 0.060%), British (64.7%, a difference of 0.070%), and Chinese (64.7%, a difference of 0.070%).
| Demographics | Rating | Rank | In Labor Force | Age > 16 |
| Croatians | 8.8 /100 | #225 | Tragic 64.7% |
| Europeans | 8.3 /100 | #226 | Tragic 64.7% |
| Poles | 8.3 /100 | #227 | Tragic 64.7% |
| Northern Europeans | 8.2 /100 | #228 | Tragic 64.7% |
| British | 7.3 /100 | #229 | Tragic 64.7% |
| Chinese | 7.3 /100 | #230 | Tragic 64.7% |
| Immigrants | Northern Europe | 7.2 /100 | #231 | Tragic 64.7% |
| Africans | 5.8 /100 | #232 | Tragic 64.6% |
| Slavs | 4.9 /100 | #233 | Tragic 64.6% |
| Vietnamese | 4.7 /100 | #234 | Tragic 64.6% |
| Austrians | 4.6 /100 | #235 | Tragic 64.6% |
| Immigrants | Norway | 4.6 /100 | #236 | Tragic 64.6% |
| Italians | 4.6 /100 | #237 | Tragic 64.6% |
| Lebanese | 3.9 /100 | #238 | Tragic 64.5% |
| Immigrants | Hungary | 3.8 /100 | #239 | Tragic 64.5% |