Immigrants from Scotland vs African Family Poverty
COMPARE
Immigrants from Scotland
African
Family Poverty
Family Poverty Comparison
Immigrants from Scotland
Africans
7.3%
FAMILY POVERTY
99.6/ 100
METRIC RATING
27th/ 347
METRIC RANK
11.8%
FAMILY POVERTY
0.0/ 100
METRIC RATING
303rd/ 347
METRIC RANK
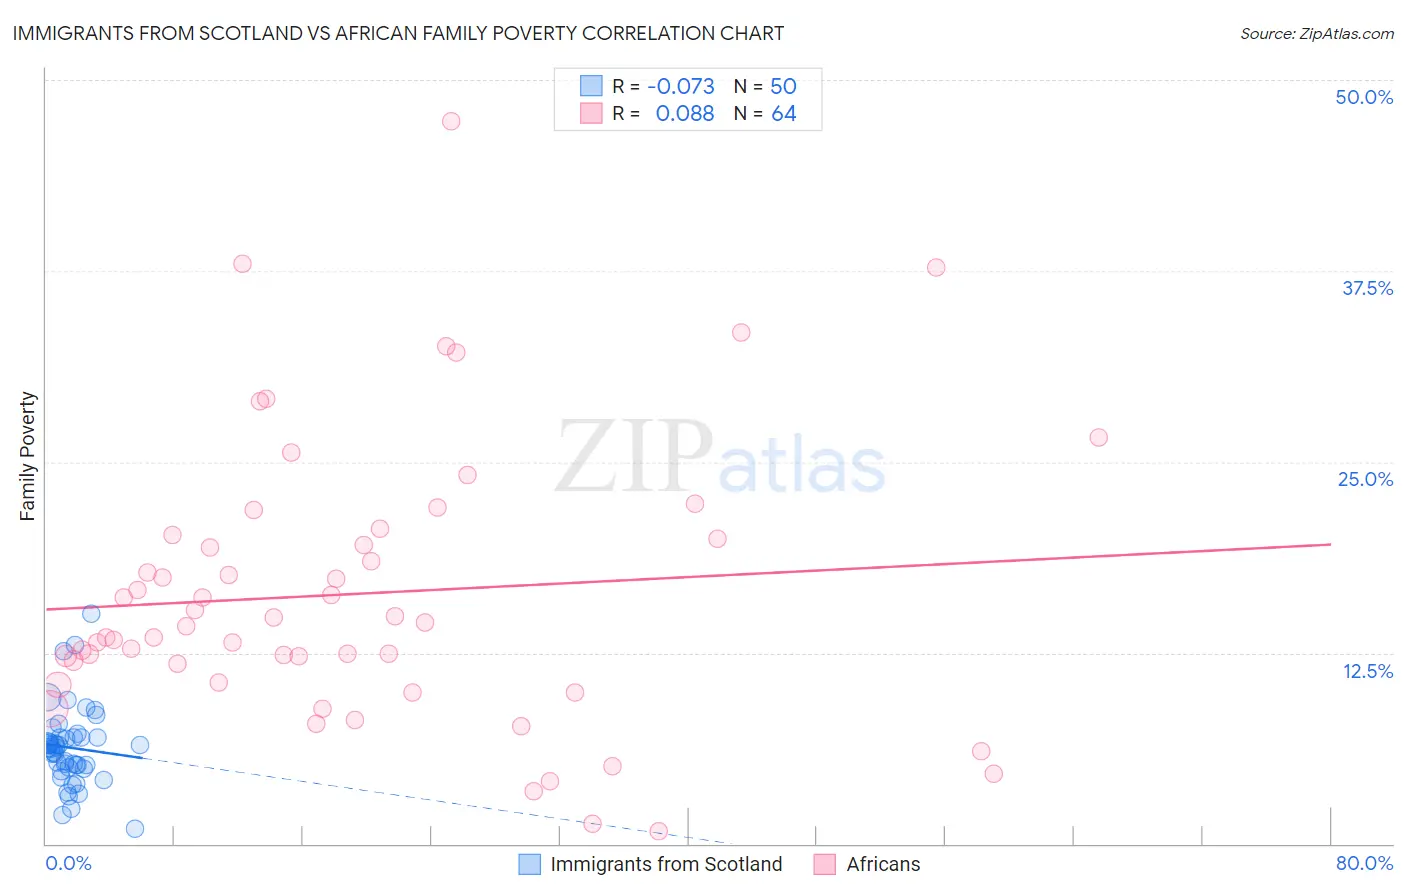
Immigrants from Scotland vs African Family Poverty Correlation Chart
The statistical analysis conducted on geographies consisting of 196,152,148 people shows a slight negative correlation between the proportion of Immigrants from Scotland and poverty level among families in the United States with a correlation coefficient (R) of -0.073 and weighted average of 7.3%. Similarly, the statistical analysis conducted on geographies consisting of 468,652,941 people shows a slight positive correlation between the proportion of Africans and poverty level among families in the United States with a correlation coefficient (R) of 0.088 and weighted average of 11.8%, a difference of 60.4%.
Family Poverty Correlation Summary
| Measurement | Immigrants from Scotland | African |
| Minimum | 1.00% | 0.78% |
| Maximum | 15.1% | 47.3% |
| Range | 14.1% | 46.5% |
| Mean | 6.3% | 16.4% |
| Median | 6.3% | 14.4% |
| Interquartile 25% (IQ1) | 5.0% | 11.2% |
| Interquartile 75% (IQ3) | 7.0% | 20.1% |
| Interquartile Range (IQR) | 2.0% | 9.0% |
| Standard Deviation (Sample) | 2.6% | 9.2% |
| Standard Deviation (Population) | 2.6% | 9.1% |
Similar Demographics by Family Poverty
Demographics Similar to Immigrants from Scotland by Family Poverty
In terms of family poverty, the demographic groups most similar to Immigrants from Scotland are Cypriot (7.3%, a difference of 0.020%), Croatian (7.3%, a difference of 0.26%), Burmese (7.3%, a difference of 0.26%), Immigrants from Korea (7.4%, a difference of 0.39%), and Immigrants from Northern Europe (7.4%, a difference of 0.55%).
| Demographics | Rating | Rank | Family Poverty |
| Immigrants | Hong Kong | 99.7 /100 | #20 | Exceptional 7.3% |
| Immigrants | Iran | 99.7 /100 | #21 | Exceptional 7.3% |
| Danes | 99.7 /100 | #22 | Exceptional 7.3% |
| Assyrians/Chaldeans/Syriacs | 99.7 /100 | #23 | Exceptional 7.3% |
| Croatians | 99.7 /100 | #24 | Exceptional 7.3% |
| Burmese | 99.7 /100 | #25 | Exceptional 7.3% |
| Cypriots | 99.6 /100 | #26 | Exceptional 7.3% |
| Immigrants | Scotland | 99.6 /100 | #27 | Exceptional 7.3% |
| Immigrants | Korea | 99.6 /100 | #28 | Exceptional 7.4% |
| Immigrants | Northern Europe | 99.6 /100 | #29 | Exceptional 7.4% |
| Italians | 99.6 /100 | #30 | Exceptional 7.4% |
| Czechs | 99.6 /100 | #31 | Exceptional 7.4% |
| Poles | 99.5 /100 | #32 | Exceptional 7.4% |
| Immigrants | Japan | 99.5 /100 | #33 | Exceptional 7.4% |
| Russians | 99.5 /100 | #34 | Exceptional 7.5% |
Demographics Similar to Africans by Family Poverty
In terms of family poverty, the demographic groups most similar to Africans are Immigrants from Latin America (11.8%, a difference of 0.19%), Mexican (11.8%, a difference of 0.37%), Guatemalan (11.7%, a difference of 0.50%), Bahamian (11.7%, a difference of 0.54%), and Immigrants from Bangladesh (11.7%, a difference of 0.80%).
| Demographics | Rating | Rank | Family Poverty |
| Choctaw | 0.0 /100 | #296 | Tragic 11.6% |
| Creek | 0.0 /100 | #297 | Tragic 11.7% |
| Immigrants | Senegal | 0.0 /100 | #298 | Tragic 11.7% |
| Dutch West Indians | 0.0 /100 | #299 | Tragic 11.7% |
| Immigrants | Bangladesh | 0.0 /100 | #300 | Tragic 11.7% |
| Bahamians | 0.0 /100 | #301 | Tragic 11.7% |
| Guatemalans | 0.0 /100 | #302 | Tragic 11.7% |
| Africans | 0.0 /100 | #303 | Tragic 11.8% |
| Immigrants | Latin America | 0.0 /100 | #304 | Tragic 11.8% |
| Mexicans | 0.0 /100 | #305 | Tragic 11.8% |
| Cajuns | 0.0 /100 | #306 | Tragic 11.9% |
| Immigrants | Congo | 0.0 /100 | #307 | Tragic 11.9% |
| Seminole | 0.0 /100 | #308 | Tragic 11.9% |
| Hispanics or Latinos | 0.0 /100 | #309 | Tragic 12.0% |
| Immigrants | Guatemala | 0.0 /100 | #310 | Tragic 12.0% |