Tlingit-Haida vs African Child Poverty Among Boys Under 16
COMPARE
Tlingit-Haida
African
Child Poverty Among Boys Under 16
Child Poverty Among Boys Under 16 Comparison
Tlingit-Haida
Africans
15.3%
CHILD POVERTY AMONG BOYS UNDER 16
92.2/ 100
METRIC RATING
124th/ 347
METRIC RANK
21.7%
CHILD POVERTY AMONG BOYS UNDER 16
0.0/ 100
METRIC RATING
317th/ 347
METRIC RANK
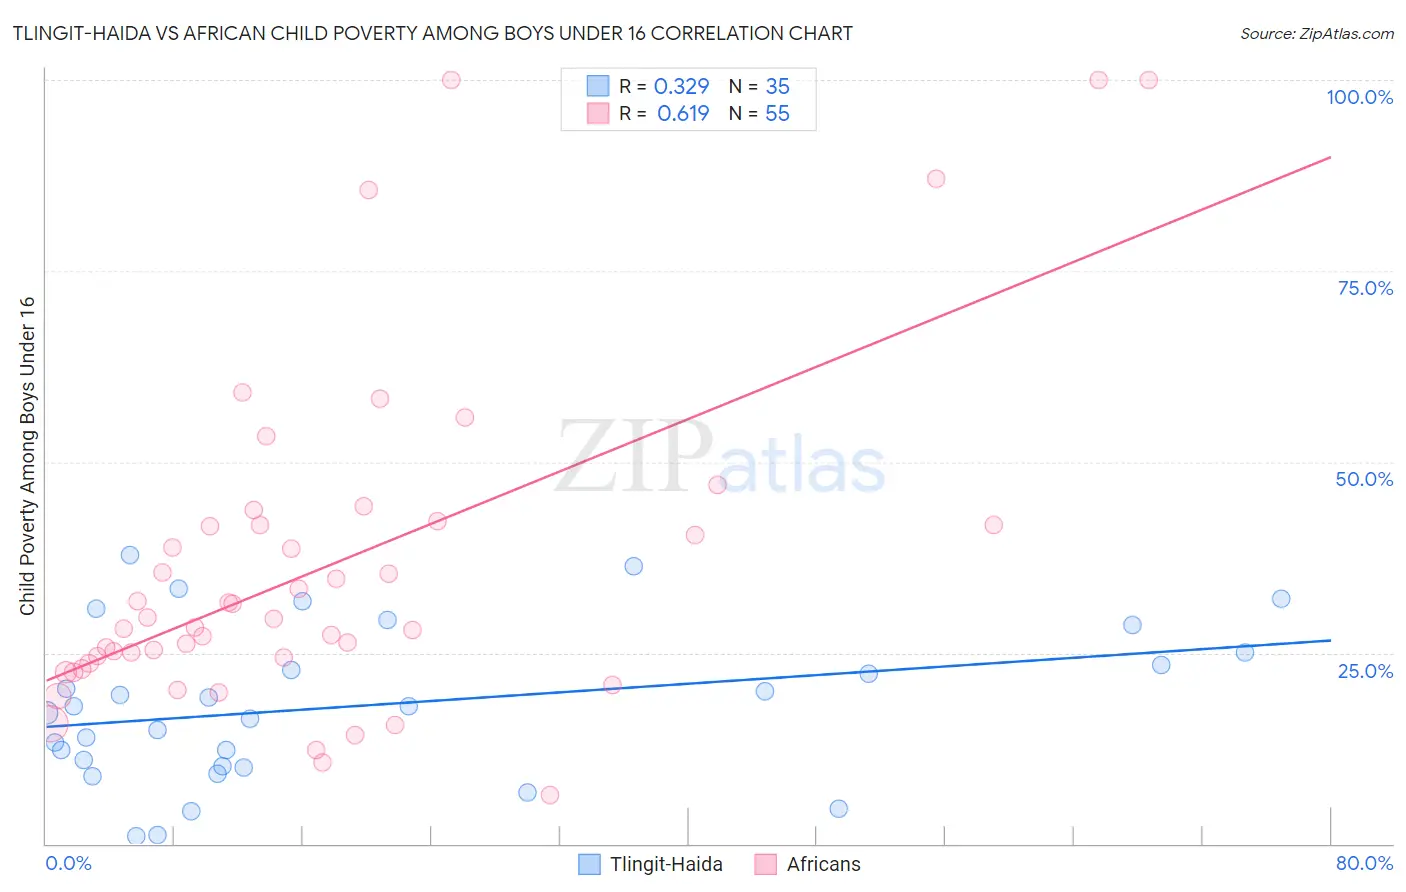
Tlingit-Haida vs African Child Poverty Among Boys Under 16 Correlation Chart
The statistical analysis conducted on geographies consisting of 60,443,448 people shows a mild positive correlation between the proportion of Tlingit-Haida and poverty level among boys under the age of 16 in the United States with a correlation coefficient (R) of 0.329 and weighted average of 15.3%. Similarly, the statistical analysis conducted on geographies consisting of 463,090,980 people shows a significant positive correlation between the proportion of Africans and poverty level among boys under the age of 16 in the United States with a correlation coefficient (R) of 0.619 and weighted average of 21.7%, a difference of 42.0%.
Child Poverty Among Boys Under 16 Correlation Summary
| Measurement | Tlingit-Haida | African |
| Minimum | 0.92% | 6.5% |
| Maximum | 37.8% | 100.0% |
| Range | 36.9% | 93.5% |
| Mean | 18.1% | 36.4% |
| Median | 18.0% | 29.5% |
| Interquartile 25% (IQ1) | 10.2% | 23.6% |
| Interquartile 75% (IQ3) | 25.0% | 41.7% |
| Interquartile Range (IQR) | 14.8% | 18.1% |
| Standard Deviation (Sample) | 10.0% | 21.9% |
| Standard Deviation (Population) | 9.9% | 21.7% |
Similar Demographics by Child Poverty Among Boys Under 16
Demographics Similar to Tlingit-Haida by Child Poverty Among Boys Under 16
In terms of child poverty among boys under 16, the demographic groups most similar to Tlingit-Haida are Immigrants from Norway (15.3%, a difference of 0.010%), Czechoslovakian (15.3%, a difference of 0.070%), Immigrants from Malaysia (15.3%, a difference of 0.23%), Scottish (15.2%, a difference of 0.33%), and South African (15.2%, a difference of 0.34%).
| Demographics | Rating | Rank | Child Poverty Among Boys Under 16 |
| Immigrants | Vietnam | 93.5 /100 | #117 | Exceptional 15.2% |
| Native Hawaiians | 93.4 /100 | #118 | Exceptional 15.2% |
| Belgians | 93.1 /100 | #119 | Exceptional 15.2% |
| South Africans | 93.0 /100 | #120 | Exceptional 15.2% |
| Scottish | 93.0 /100 | #121 | Exceptional 15.2% |
| Immigrants | Malaysia | 92.8 /100 | #122 | Exceptional 15.3% |
| Immigrants | Norway | 92.3 /100 | #123 | Exceptional 15.3% |
| Tlingit-Haida | 92.2 /100 | #124 | Exceptional 15.3% |
| Czechoslovakians | 92.1 /100 | #125 | Exceptional 15.3% |
| Palestinians | 91.3 /100 | #126 | Exceptional 15.4% |
| Carpatho Rusyns | 91.1 /100 | #127 | Exceptional 15.4% |
| Canadians | 90.6 /100 | #128 | Exceptional 15.4% |
| Immigrants | Brazil | 90.3 /100 | #129 | Exceptional 15.4% |
| Mongolians | 90.2 /100 | #130 | Exceptional 15.4% |
| Immigrants | Western Europe | 90.0 /100 | #131 | Exceptional 15.4% |
Demographics Similar to Africans by Child Poverty Among Boys Under 16
In terms of child poverty among boys under 16, the demographic groups most similar to Africans are Yakama (21.7%, a difference of 0.060%), Menominee (21.7%, a difference of 0.080%), Immigrants from Somalia (21.7%, a difference of 0.090%), Dutch West Indian (21.8%, a difference of 0.54%), and Ute (21.6%, a difference of 0.69%).
| Demographics | Rating | Rank | Child Poverty Among Boys Under 16 |
| Creek | 0.0 /100 | #310 | Tragic 21.5% |
| Bahamians | 0.0 /100 | #311 | Tragic 21.6% |
| Immigrants | Guatemala | 0.0 /100 | #312 | Tragic 21.6% |
| British West Indians | 0.0 /100 | #313 | Tragic 21.6% |
| Ute | 0.0 /100 | #314 | Tragic 21.6% |
| Immigrants | Somalia | 0.0 /100 | #315 | Tragic 21.7% |
| Menominee | 0.0 /100 | #316 | Tragic 21.7% |
| Africans | 0.0 /100 | #317 | Tragic 21.7% |
| Yakama | 0.0 /100 | #318 | Tragic 21.7% |
| Dutch West Indians | 0.0 /100 | #319 | Tragic 21.8% |
| U.S. Virgin Islanders | 0.0 /100 | #320 | Tragic 22.0% |
| Cajuns | 0.0 /100 | #321 | Tragic 22.2% |
| Immigrants | Dominica | 0.0 /100 | #322 | Tragic 22.2% |
| Hondurans | 0.0 /100 | #323 | Tragic 22.3% |
| Immigrants | Congo | 0.0 /100 | #324 | Tragic 22.4% |