Alsatian vs African Child Poverty Among Boys Under 16

COMPARE

Alsatian
Race
Ancestry
AfghanAlaska NativeAlaskan AthabascanAlbanianAleutAlsatianAmericanApacheArabArapahoArgentineanArmenianAssyrian/Chaldean/SyriacAustralianAustrianBahamianBangladeshiBarbadianBasqueBelgianBelizeanBermudanBhutaneseBlackfeetBolivianBrazilianBritishBritish West IndianBulgarianBurmeseCajunCambodianCanadianCape VerdeanCarpatho RusynCelticCentral AmericanCentral American IndianCherokeeCheyenneChickasawChileanChineseChippewaChoctawColombianColvilleComancheCosta RicanCreeCreekCroatianCrowCubanCypriotCzechCzechoslovakianDanishDelawareDominicanDutchDutch West IndianEastern EuropeanEcuadorianEgyptianEnglishEstonianEthiopianEuropeanFijianFilipinoFinnishFrenchFrench American IndianFrench CanadianGermanGerman RussianGhanaianGreekGuamanian/ChamorroGuatemalanGuyaneseHaitianHmongHonduranHopiHoumaHungarianIcelanderIndian (Asian)IndonesianInupiatIranianIraqiIrishIroquoisIsraeliItalianJamaicanJapaneseJordanianKenyanKiowaKoreanLaotianLatvianLebaneseLiberianLithuanianLumbeeLuxembourgerMacedonianMalaysianMalteseMarshalleseMenomineeMexicanMexican American IndianMongolianMoroccanNative HawaiianNavajoNepaleseNew ZealanderNicaraguanNigerianNorthern EuropeanNorwegianOkinawanOsageOttawaPaiutePakistaniPalestinianPanamanianParaguayanPennsylvania GermanPeruvianPimaPolishPortuguesePotawatomiPuebloPuerto RicanPuget Sound SalishRomanianRussianSalvadoranSamoanScandinavianScotch-IrishScottishSeminoleSenegaleseSerbianShoshoneSierra LeoneanSiouxSlavicSlovakSloveneSomaliSouth AfricanSouth AmericanSouth American IndianSoviet UnionSpaniardSpanishSpanish AmericanSpanish American IndianSri LankanSubsaharan AfricanSudaneseSwedishSwissSyrianTaiwaneseThaiTlingit-HaidaTohono O'OdhamTonganTrinidadian and TobagonianTsimshianTurkishU.S. Virgin IslanderUgandanUkrainianUruguayanUteVenezuelanVietnameseWelshWest IndianYakamaYaquiYugoslavianYumanYup'ikZimbabwean
Immigration
NonimmigrantsImmigrantsAfghanistanAfricaAlbaniaArgentinaArmeniaAsiaAustraliaAustriaBahamasBangladeshBarbadosBelarusBelgiumBelizeBoliviaBosnia and HerzegovinaBrazilBulgariaBurma/MyanmarCabo VerdeCambodiaCameroonCanadaCaribbeanCentral AmericaChileChinaColombiaCongoCosta RicaCroatiaCubaCzechoslovakiaDenmarkDominicaDominican RepublicEastern AfricaEastern AsiaEastern EuropeEcuadorEgyptEl SalvadorEnglandEritreaEthiopiaEuropeFijiFranceGermanyGhanaGreeceGrenadaGuatemalaGuyanaHaitiHondurasHong KongHungaryIndiaIndonesiaIranIraqIrelandIsraelItalyJamaicaJapanJordanKazakhstanKenyaKoreaKuwaitLaosLatin AmericaLatviaLebanonLiberiaLithuaniaMalaysiaMexicoMicronesiaMiddle AfricaMoldovaMoroccoNepalNetherlandsNicaraguaNigeriaNorth AmericaNorth MacedoniaNorthern AfricaNorthern EuropeNorwayOceaniaPakistanPanamaPeruPhilippinesPolandPortugalRomaniaRussiaSaudi ArabiaScotlandSenegalSerbiaSierra LeoneSingaporeSomaliaSouth AfricaSouth AmericaSouth Central AsiaSouth Eastern AsiaSouthern EuropeSpainSri LankaSt. Vincent and the GrenadinesSudanSwedenSwitzerlandSyriaTaiwanThailandTrinidad and TobagoTurkeyUgandaUkraineUruguayUzbekistanVenezuelaVietnamWest IndiesWestern AfricaWestern AsiaWestern EuropeYemenZaireZimbabweAzores
African
Race
Ancestry
AfghanAfricanAlaska NativeAlaskan AthabascanAlbanianAleutAmericanApacheArabArapahoArgentineanArmenianAssyrian/Chaldean/SyriacAustralianAustrianBahamianBangladeshiBarbadianBasqueBelgianBelizeanBermudanBhutaneseBlackfeetBolivianBrazilianBritishBritish West IndianBulgarianBurmeseCajunCambodianCanadianCape VerdeanCarpatho RusynCelticCentral AmericanCentral American IndianCherokeeCheyenneChickasawChileanChineseChippewaChoctawColombianColvilleComancheCosta RicanCreeCreekCroatianCrowCubanCypriotCzechCzechoslovakianDanishDelawareDominicanDutchDutch West IndianEastern EuropeanEcuadorianEgyptianEnglishEstonianEthiopianEuropeanFijianFilipinoFinnishFrenchFrench American IndianFrench CanadianGermanGerman RussianGhanaianGreekGuamanian/ChamorroGuatemalanGuyaneseHaitianHmongHonduranHopiHoumaHungarianIcelanderIndian (Asian)IndonesianInupiatIranianIraqiIrishIroquoisIsraeliItalianJamaicanJapaneseJordanianKenyanKiowaKoreanLaotianLatvianLebaneseLiberianLithuanianLumbeeLuxembourgerMacedonianMalaysianMalteseMarshalleseMenomineeMexicanMexican American IndianMongolianMoroccanNative HawaiianNavajoNepaleseNew ZealanderNicaraguanNigerianNorthern EuropeanNorwegianOkinawanOsageOttawaPaiutePakistaniPalestinianPanamanianParaguayanPennsylvania GermanPeruvianPimaPolishPortuguesePotawatomiPuebloPuerto RicanPuget Sound SalishRomanianRussianSalvadoranSamoanScandinavianScotch-IrishScottishSeminoleSenegaleseSerbianShoshoneSierra LeoneanSiouxSlavicSlovakSloveneSomaliSouth AfricanSouth AmericanSouth American IndianSoviet UnionSpaniardSpanishSpanish AmericanSpanish American IndianSri LankanSubsaharan AfricanSudaneseSwedishSwissSyrianTaiwaneseThaiTlingit-HaidaTohono O'OdhamTonganTrinidadian and TobagonianTsimshianTurkishU.S. Virgin IslanderUgandanUkrainianUruguayanUteVenezuelanVietnameseWelshWest IndianYakamaYaquiYugoslavianYumanYup'ikZimbabwean
Immigration
NonimmigrantsImmigrantsAfghanistanAfricaAlbaniaArgentinaArmeniaAsiaAustraliaAustriaBahamasBangladeshBarbadosBelarusBelgiumBelizeBoliviaBosnia and HerzegovinaBrazilBulgariaBurma/MyanmarCabo VerdeCambodiaCameroonCanadaCaribbeanCentral AmericaChileChinaColombiaCongoCosta RicaCroatiaCubaCzechoslovakiaDenmarkDominicaDominican RepublicEastern AfricaEastern AsiaEastern EuropeEcuadorEgyptEl SalvadorEnglandEritreaEthiopiaEuropeFijiFranceGermanyGhanaGreeceGrenadaGuatemalaGuyanaHaitiHondurasHong KongHungaryIndiaIndonesiaIranIraqIrelandIsraelItalyJamaicaJapanJordanKazakhstanKenyaKoreaKuwaitLaosLatin AmericaLatviaLebanonLiberiaLithuaniaMalaysiaMexicoMicronesiaMiddle AfricaMoldovaMoroccoNepalNetherlandsNicaraguaNigeriaNorth AmericaNorth MacedoniaNorthern AfricaNorthern EuropeNorwayOceaniaPakistanPanamaPeruPhilippinesPolandPortugalRomaniaRussiaSaudi ArabiaScotlandSenegalSerbiaSierra LeoneSingaporeSomaliaSouth AfricaSouth AmericaSouth Central AsiaSouth Eastern AsiaSouthern EuropeSpainSri LankaSt. Vincent and the GrenadinesSudanSwedenSwitzerlandSyriaTaiwanThailandTrinidad and TobagoTurkeyUgandaUkraineUruguayUzbekistanVenezuelaVietnamWest IndiesWestern AfricaWestern AsiaWestern EuropeYemenZaireZimbabweAzores
Child Poverty Among Boys Under 16
Income
Poverty
Unemployment
Labor Participation
Family Structure
Vehicle Availability
Education Level
Disability

Child Poverty Among Boys Under 16 Comparison

Alsatians

Africans

Tragic
Tragic
19.1%
CHILD POVERTY AMONG BOYS UNDER 16
0.3/ 100
METRIC RATING
249th/ 347
METRIC RANK
21.7%
CHILD POVERTY AMONG BOYS UNDER 16
0.0/ 100
METRIC RATING
317th/ 347
METRIC RANK

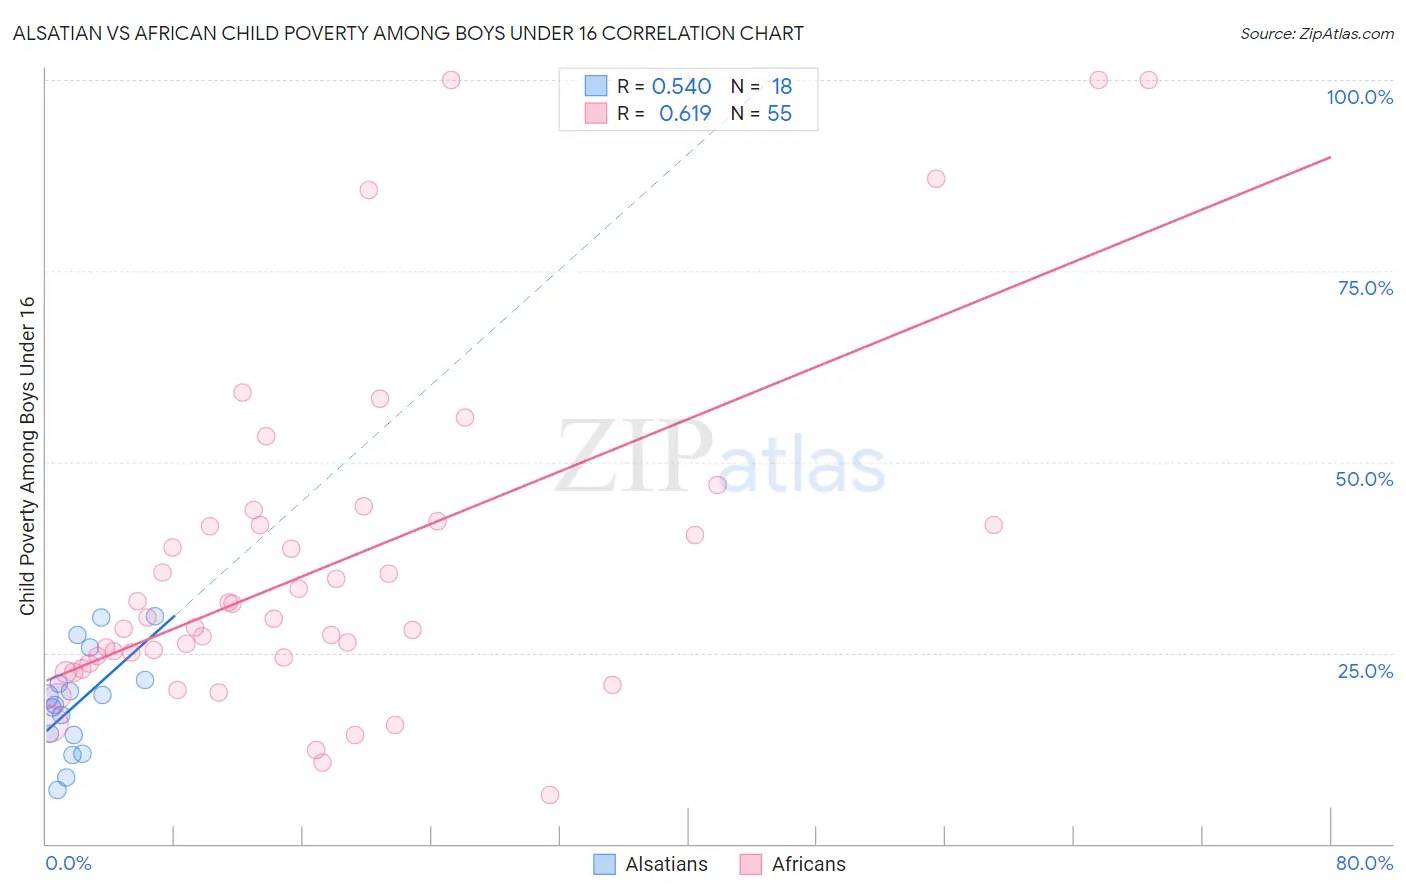
Alsatian vs African Child Poverty Among Boys Under 16 Correlation Chart

The statistical analysis conducted on geographies consisting of 82,051,026 people shows a substantial positive correlation between the proportion of Alsatians and poverty level among boys under the age of 16 in the United States with a correlation coefficient (R) of 0.540 and weighted average of 19.1%. Similarly, the statistical analysis conducted on geographies consisting of 463,090,980 people shows a significant positive correlation between the proportion of Africans and poverty level among boys under the age of 16 in the United States with a correlation coefficient (R) of 0.619 and weighted average of 21.7%, a difference of 13.9%.
Alsatian vs African Child Poverty Among Boys Under 16

Child Poverty Among Boys Under 16 Correlation Summary

MeasurementAlsatianAfrican
Minimum7.1%6.5%
Maximum29.7%100.0%
Range22.7%93.5%
Mean18.6%36.4%
Median18.7%29.5%
Interquartile 25% (IQ1)14.3%23.6%
Interquartile 75% (IQ3)21.5%41.7%
Interquartile Range (IQR)7.2%18.1%
Standard Deviation (Sample)6.7%21.9%
Standard Deviation (Population)6.5%21.7%

Similar Demographics by Child Poverty Among Boys Under 16

Demographics Similar to Alsatians by Child Poverty Among Boys Under 16

In terms of child poverty among boys under 16, the demographic groups most similar to Alsatians are Salvadoran (19.0%, a difference of 0.17%), Immigrants from Trinidad and Tobago (19.0%, a difference of 0.25%), Immigrants from Nicaragua (19.0%, a difference of 0.37%), Cree (19.0%, a difference of 0.57%), and Immigrants from Middle Africa (18.9%, a difference of 0.70%).
DemographicsRating | RankChild Poverty Among Boys Under 16
Ghanaians
0.5
/100
|
#242
Tragic
18.9%
Immigrants | Azores
0.4
/100
|
#243
Tragic
18.9%
Immigrants | Middle Africa
0.4
/100
|
#244
Tragic
18.9%
Cree
0.4
/100
|
#245
Tragic
19.0%
Immigrants | Nicaragua
0.4
/100
|
#246
Tragic
19.0%
Immigrants | Trinidad and Tobago
0.3
/100
|
#247
Tragic
19.0%
Salvadorans
0.3
/100
|
#248
Tragic
19.0%
Alsatians
0.3
/100
|
#249
Tragic
19.1%
Immigrants | Burma/Myanmar
0.2
/100
|
#250
Tragic
19.2%
French American Indians
0.2
/100
|
#251
Tragic
19.2%
Immigrants | Western Africa
0.2
/100
|
#252
Tragic
19.3%
Liberians
0.2
/100
|
#253
Tragic
19.3%
Trinidadians and Tobagonians
0.2
/100
|
#254
Tragic
19.3%
Ecuadorians
0.2
/100
|
#255
Tragic
19.3%
Immigrants | Liberia
0.2
/100
|
#256
Tragic
19.3%

Demographics Similar to Africans by Child Poverty Among Boys Under 16

In terms of child poverty among boys under 16, the demographic groups most similar to Africans are Yakama (21.7%, a difference of 0.060%), Menominee (21.7%, a difference of 0.080%), Immigrants from Somalia (21.7%, a difference of 0.090%), Dutch West Indian (21.8%, a difference of 0.54%), and Ute (21.6%, a difference of 0.69%).
DemographicsRating | RankChild Poverty Among Boys Under 16
Creek
0.0
/100
|
#310
Tragic
21.5%
Bahamians
0.0
/100
|
#311
Tragic
21.6%
Immigrants | Guatemala
0.0
/100
|
#312
Tragic
21.6%
British West Indians
0.0
/100
|
#313
Tragic
21.6%
Ute
0.0
/100
|
#314
Tragic
21.6%
Immigrants | Somalia
0.0
/100
|
#315
Tragic
21.7%
Menominee
0.0
/100
|
#316
Tragic
21.7%
Africans
0.0
/100
|
#317
Tragic
21.7%
Yakama
0.0
/100
|
#318
Tragic
21.7%
Dutch West Indians
0.0
/100
|
#319
Tragic
21.8%
U.S. Virgin Islanders
0.0
/100
|
#320
Tragic
22.0%
Cajuns
0.0
/100
|
#321
Tragic
22.2%
Immigrants | Dominica
0.0
/100
|
#322
Tragic
22.2%
Hondurans
0.0
/100
|
#323
Tragic
22.3%
Immigrants | Congo
0.0
/100
|
#324
Tragic
22.4%