Tlingit-Haida vs Colville Child Poverty Among Boys Under 16
COMPARE
Tlingit-Haida
Colville
Child Poverty Among Boys Under 16
Child Poverty Among Boys Under 16 Comparison
Tlingit-Haida
Colville
15.3%
CHILD POVERTY AMONG BOYS UNDER 16
92.2/ 100
METRIC RATING
124th/ 347
METRIC RANK
24.1%
CHILD POVERTY AMONG BOYS UNDER 16
0.0/ 100
METRIC RATING
330th/ 347
METRIC RANK
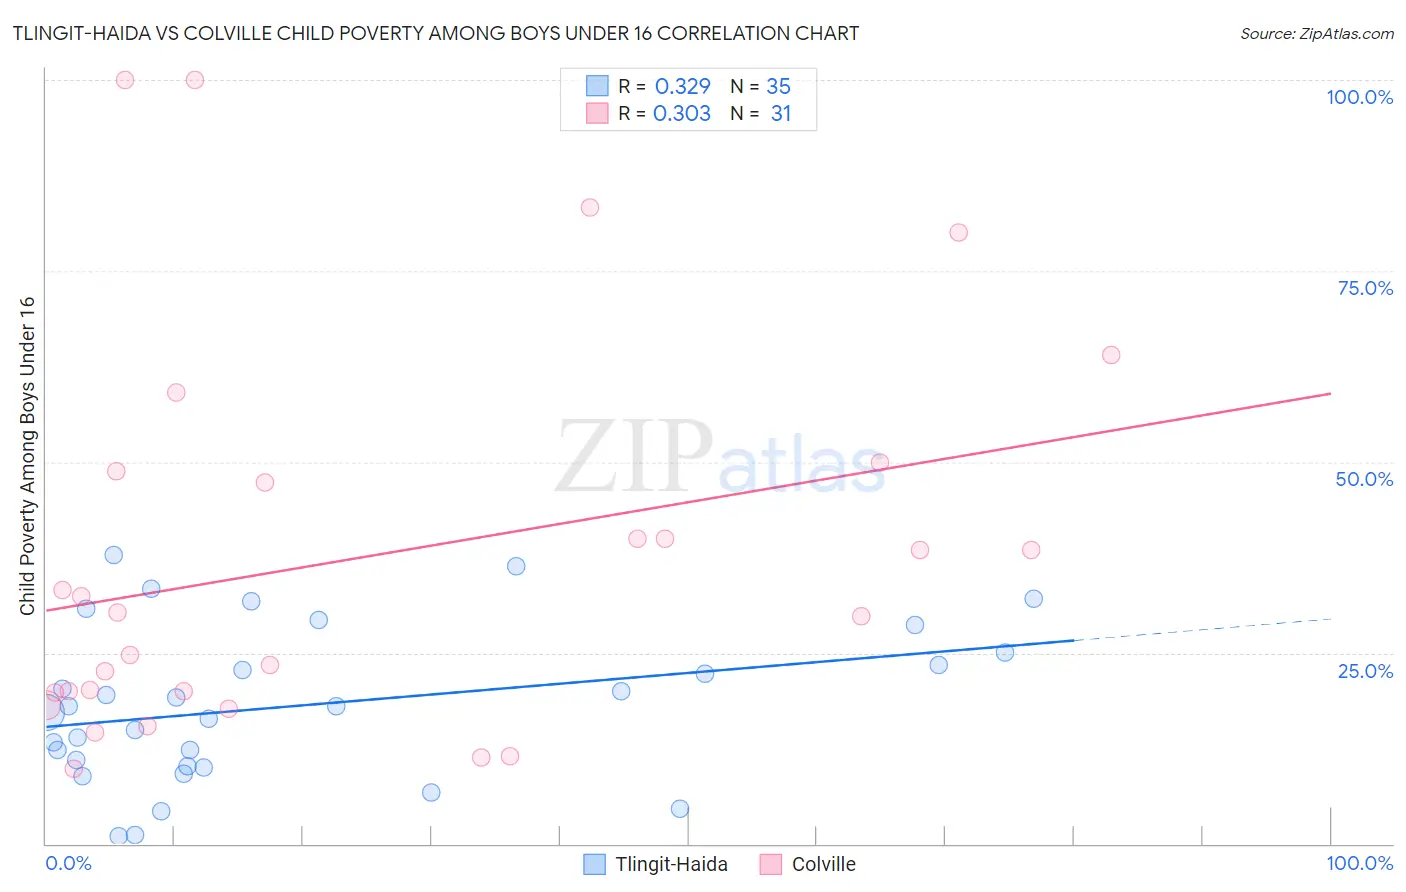
Tlingit-Haida vs Colville Child Poverty Among Boys Under 16 Correlation Chart
The statistical analysis conducted on geographies consisting of 60,443,448 people shows a mild positive correlation between the proportion of Tlingit-Haida and poverty level among boys under the age of 16 in the United States with a correlation coefficient (R) of 0.329 and weighted average of 15.3%. Similarly, the statistical analysis conducted on geographies consisting of 34,562,451 people shows a mild positive correlation between the proportion of Colville and poverty level among boys under the age of 16 in the United States with a correlation coefficient (R) of 0.303 and weighted average of 24.1%, a difference of 57.5%.
Child Poverty Among Boys Under 16 Correlation Summary
| Measurement | Tlingit-Haida | Colville |
| Minimum | 0.92% | 9.8% |
| Maximum | 37.8% | 100.0% |
| Range | 36.9% | 90.2% |
| Mean | 18.1% | 37.5% |
| Median | 18.0% | 30.4% |
| Interquartile 25% (IQ1) | 10.2% | 19.7% |
| Interquartile 75% (IQ3) | 25.0% | 48.8% |
| Interquartile Range (IQR) | 14.8% | 29.1% |
| Standard Deviation (Sample) | 10.0% | 25.3% |
| Standard Deviation (Population) | 9.9% | 24.9% |
Similar Demographics by Child Poverty Among Boys Under 16
Demographics Similar to Tlingit-Haida by Child Poverty Among Boys Under 16
In terms of child poverty among boys under 16, the demographic groups most similar to Tlingit-Haida are Immigrants from Norway (15.3%, a difference of 0.010%), Czechoslovakian (15.3%, a difference of 0.070%), Immigrants from Malaysia (15.3%, a difference of 0.23%), Scottish (15.2%, a difference of 0.33%), and South African (15.2%, a difference of 0.34%).
| Demographics | Rating | Rank | Child Poverty Among Boys Under 16 |
| Immigrants | Vietnam | 93.5 /100 | #117 | Exceptional 15.2% |
| Native Hawaiians | 93.4 /100 | #118 | Exceptional 15.2% |
| Belgians | 93.1 /100 | #119 | Exceptional 15.2% |
| South Africans | 93.0 /100 | #120 | Exceptional 15.2% |
| Scottish | 93.0 /100 | #121 | Exceptional 15.2% |
| Immigrants | Malaysia | 92.8 /100 | #122 | Exceptional 15.3% |
| Immigrants | Norway | 92.3 /100 | #123 | Exceptional 15.3% |
| Tlingit-Haida | 92.2 /100 | #124 | Exceptional 15.3% |
| Czechoslovakians | 92.1 /100 | #125 | Exceptional 15.3% |
| Palestinians | 91.3 /100 | #126 | Exceptional 15.4% |
| Carpatho Rusyns | 91.1 /100 | #127 | Exceptional 15.4% |
| Canadians | 90.6 /100 | #128 | Exceptional 15.4% |
| Immigrants | Brazil | 90.3 /100 | #129 | Exceptional 15.4% |
| Mongolians | 90.2 /100 | #130 | Exceptional 15.4% |
| Immigrants | Western Europe | 90.0 /100 | #131 | Exceptional 15.4% |
Demographics Similar to Colville by Child Poverty Among Boys Under 16
In terms of child poverty among boys under 16, the demographic groups most similar to Colville are Dominican (24.2%, a difference of 0.34%), Native/Alaskan (24.0%, a difference of 0.58%), Immigrants from Dominican Republic (24.3%, a difference of 0.93%), Apache (24.5%, a difference of 1.7%), and Black/African American (24.5%, a difference of 1.8%).
| Demographics | Rating | Rank | Child Poverty Among Boys Under 16 |
| Hondurans | 0.0 /100 | #323 | Tragic 22.3% |
| Immigrants | Congo | 0.0 /100 | #324 | Tragic 22.4% |
| Central American Indians | 0.0 /100 | #325 | Tragic 22.5% |
| Paiute | 0.0 /100 | #326 | Tragic 22.8% |
| Immigrants | Honduras | 0.0 /100 | #327 | Tragic 22.8% |
| Pueblo | 0.0 /100 | #328 | Tragic 23.5% |
| Natives/Alaskans | 0.0 /100 | #329 | Tragic 24.0% |
| Colville | 0.0 /100 | #330 | Tragic 24.1% |
| Dominicans | 0.0 /100 | #331 | Tragic 24.2% |
| Immigrants | Dominican Republic | 0.0 /100 | #332 | Tragic 24.3% |
| Apache | 0.0 /100 | #333 | Tragic 24.5% |
| Blacks/African Americans | 0.0 /100 | #334 | Tragic 24.5% |
| Yup'ik | 0.0 /100 | #335 | Tragic 24.7% |
| Sioux | 0.0 /100 | #336 | Tragic 25.3% |
| Cheyenne | 0.0 /100 | #337 | Tragic 25.8% |