Tlingit-Haida vs Spaniard Child Poverty Among Boys Under 16
COMPARE
Tlingit-Haida
Spaniard
Child Poverty Among Boys Under 16
Child Poverty Among Boys Under 16 Comparison
Tlingit-Haida
Spaniards
15.3%
CHILD POVERTY AMONG BOYS UNDER 16
92.2/ 100
METRIC RATING
124th/ 347
METRIC RANK
17.1%
CHILD POVERTY AMONG BOYS UNDER 16
20.5/ 100
METRIC RATING
196th/ 347
METRIC RANK
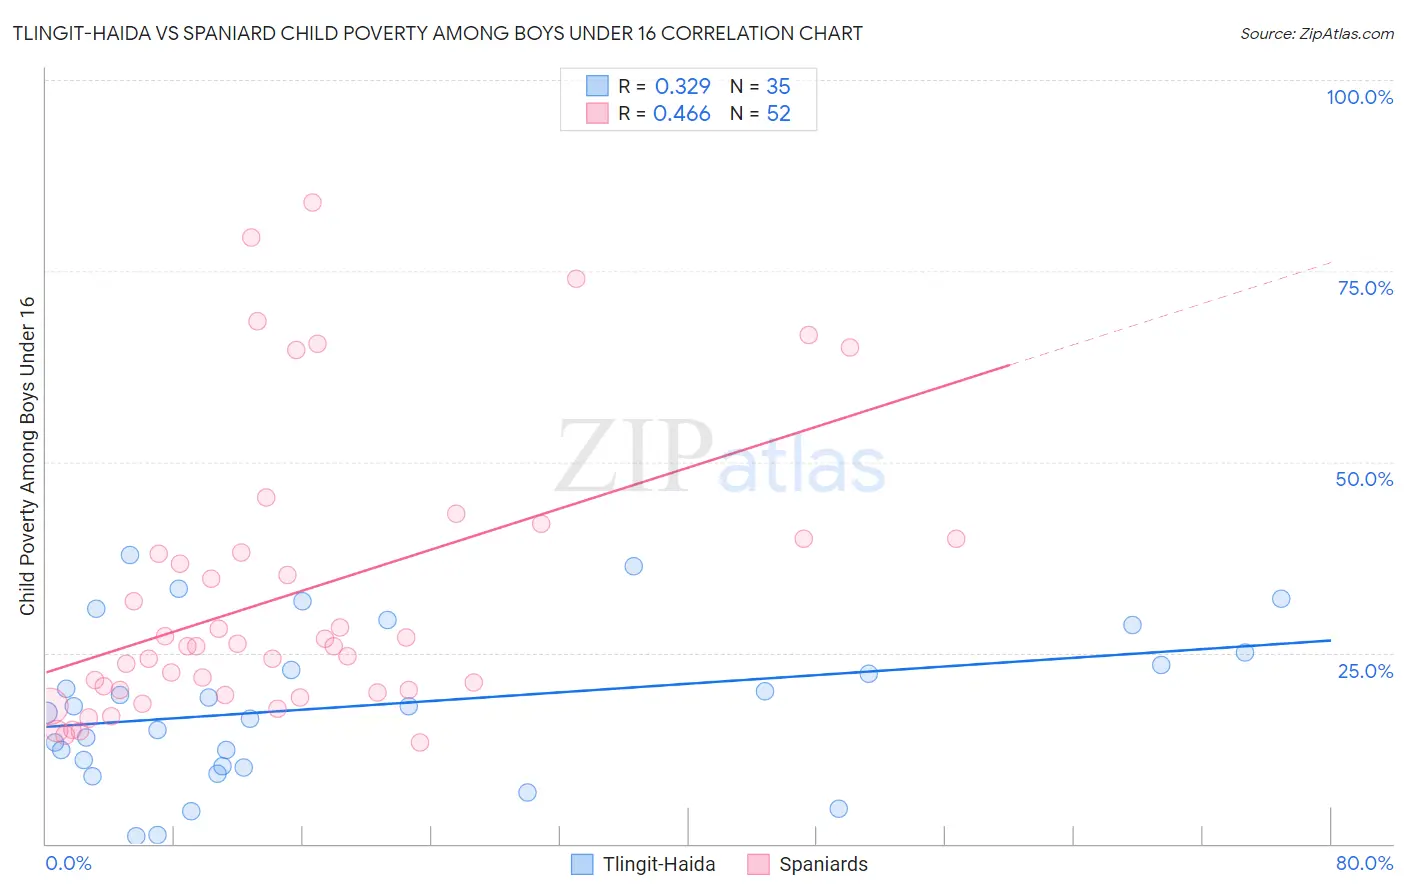
Tlingit-Haida vs Spaniard Child Poverty Among Boys Under 16 Correlation Chart
The statistical analysis conducted on geographies consisting of 60,443,448 people shows a mild positive correlation between the proportion of Tlingit-Haida and poverty level among boys under the age of 16 in the United States with a correlation coefficient (R) of 0.329 and weighted average of 15.3%. Similarly, the statistical analysis conducted on geographies consisting of 435,078,567 people shows a moderate positive correlation between the proportion of Spaniards and poverty level among boys under the age of 16 in the United States with a correlation coefficient (R) of 0.466 and weighted average of 17.1%, a difference of 11.5%.
Child Poverty Among Boys Under 16 Correlation Summary
| Measurement | Tlingit-Haida | Spaniard |
| Minimum | 0.92% | 13.2% |
| Maximum | 37.8% | 83.9% |
| Range | 36.9% | 70.7% |
| Mean | 18.1% | 32.6% |
| Median | 18.0% | 25.9% |
| Interquartile 25% (IQ1) | 10.2% | 19.9% |
| Interquartile 75% (IQ3) | 25.0% | 39.1% |
| Interquartile Range (IQR) | 14.8% | 19.2% |
| Standard Deviation (Sample) | 10.0% | 18.6% |
| Standard Deviation (Population) | 9.9% | 18.4% |
Similar Demographics by Child Poverty Among Boys Under 16
Demographics Similar to Tlingit-Haida by Child Poverty Among Boys Under 16
In terms of child poverty among boys under 16, the demographic groups most similar to Tlingit-Haida are Immigrants from Norway (15.3%, a difference of 0.010%), Czechoslovakian (15.3%, a difference of 0.070%), Immigrants from Malaysia (15.3%, a difference of 0.23%), Scottish (15.2%, a difference of 0.33%), and South African (15.2%, a difference of 0.34%).
| Demographics | Rating | Rank | Child Poverty Among Boys Under 16 |
| Immigrants | Vietnam | 93.5 /100 | #117 | Exceptional 15.2% |
| Native Hawaiians | 93.4 /100 | #118 | Exceptional 15.2% |
| Belgians | 93.1 /100 | #119 | Exceptional 15.2% |
| South Africans | 93.0 /100 | #120 | Exceptional 15.2% |
| Scottish | 93.0 /100 | #121 | Exceptional 15.2% |
| Immigrants | Malaysia | 92.8 /100 | #122 | Exceptional 15.3% |
| Immigrants | Norway | 92.3 /100 | #123 | Exceptional 15.3% |
| Tlingit-Haida | 92.2 /100 | #124 | Exceptional 15.3% |
| Czechoslovakians | 92.1 /100 | #125 | Exceptional 15.3% |
| Palestinians | 91.3 /100 | #126 | Exceptional 15.4% |
| Carpatho Rusyns | 91.1 /100 | #127 | Exceptional 15.4% |
| Canadians | 90.6 /100 | #128 | Exceptional 15.4% |
| Immigrants | Brazil | 90.3 /100 | #129 | Exceptional 15.4% |
| Mongolians | 90.2 /100 | #130 | Exceptional 15.4% |
| Immigrants | Western Europe | 90.0 /100 | #131 | Exceptional 15.4% |
Demographics Similar to Spaniards by Child Poverty Among Boys Under 16
In terms of child poverty among boys under 16, the demographic groups most similar to Spaniards are Spanish (17.0%, a difference of 0.040%), Immigrants from Kenya (17.1%, a difference of 0.060%), Immigrants from Lebanon (17.0%, a difference of 0.12%), Immigrants from Uganda (17.0%, a difference of 0.18%), and Immigrants from Iraq (17.0%, a difference of 0.18%).
| Demographics | Rating | Rank | Child Poverty Among Boys Under 16 |
| Immigrants | Morocco | 34.5 /100 | #189 | Fair 16.7% |
| Arabs | 31.1 /100 | #190 | Fair 16.8% |
| Alaska Natives | 29.8 /100 | #191 | Fair 16.8% |
| Immigrants | Uganda | 21.6 /100 | #192 | Fair 17.0% |
| Immigrants | Iraq | 21.6 /100 | #193 | Fair 17.0% |
| Immigrants | Lebanon | 21.2 /100 | #194 | Fair 17.0% |
| Spanish | 20.8 /100 | #195 | Fair 17.0% |
| Spaniards | 20.5 /100 | #196 | Fair 17.1% |
| Immigrants | Kenya | 20.1 /100 | #197 | Fair 17.1% |
| Immigrants | Cameroon | 19.0 /100 | #198 | Poor 17.1% |
| Delaware | 18.8 /100 | #199 | Poor 17.1% |
| Immigrants | Uruguay | 16.9 /100 | #200 | Poor 17.2% |
| Immigrants | Afghanistan | 13.7 /100 | #201 | Poor 17.3% |
| Immigrants | Sierra Leone | 13.4 /100 | #202 | Poor 17.3% |
| Immigrants | Uzbekistan | 13.3 /100 | #203 | Poor 17.3% |