Tlingit-Haida vs Immigrants from Fiji Child Poverty Among Boys Under 16
COMPARE
Tlingit-Haida
Immigrants from Fiji
Child Poverty Among Boys Under 16
Child Poverty Among Boys Under 16 Comparison
Tlingit-Haida
Immigrants from Fiji
15.3%
CHILD POVERTY AMONG BOYS UNDER 16
92.2/ 100
METRIC RATING
124th/ 347
METRIC RANK
15.7%
CHILD POVERTY AMONG BOYS UNDER 16
83.6/ 100
METRIC RATING
143rd/ 347
METRIC RANK
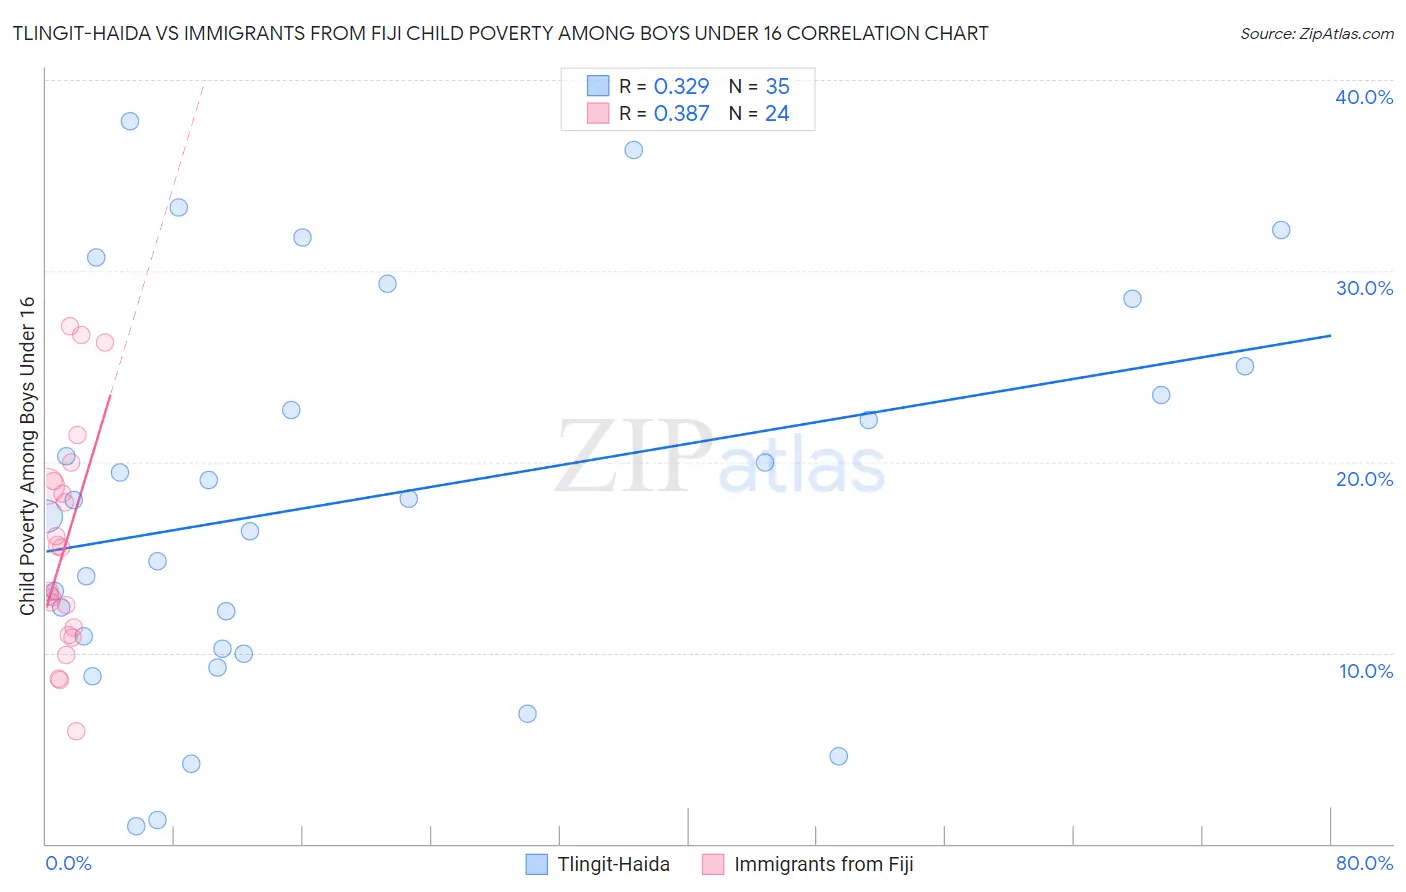
Tlingit-Haida vs Immigrants from Fiji Child Poverty Among Boys Under 16 Correlation Chart
The statistical analysis conducted on geographies consisting of 60,443,448 people shows a mild positive correlation between the proportion of Tlingit-Haida and poverty level among boys under the age of 16 in the United States with a correlation coefficient (R) of 0.329 and weighted average of 15.3%. Similarly, the statistical analysis conducted on geographies consisting of 93,482,281 people shows a mild positive correlation between the proportion of Immigrants from Fiji and poverty level among boys under the age of 16 in the United States with a correlation coefficient (R) of 0.387 and weighted average of 15.7%, a difference of 2.5%.
Child Poverty Among Boys Under 16 Correlation Summary
| Measurement | Tlingit-Haida | Immigrants from Fiji |
| Minimum | 0.92% | 5.9% |
| Maximum | 37.8% | 27.1% |
| Range | 36.9% | 21.2% |
| Mean | 18.1% | 15.5% |
| Median | 18.0% | 14.4% |
| Interquartile 25% (IQ1) | 10.2% | 11.1% |
| Interquartile 75% (IQ3) | 25.0% | 18.9% |
| Interquartile Range (IQR) | 14.8% | 7.7% |
| Standard Deviation (Sample) | 10.0% | 5.8% |
| Standard Deviation (Population) | 9.9% | 5.7% |
Demographics Similar to Tlingit-Haida and Immigrants from Fiji by Child Poverty Among Boys Under 16
In terms of child poverty among boys under 16, the demographic groups most similar to Tlingit-Haida are Immigrants from Norway (15.3%, a difference of 0.010%), Czechoslovakian (15.3%, a difference of 0.070%), Palestinian (15.4%, a difference of 0.39%), Carpatho Rusyn (15.4%, a difference of 0.43%), and Canadian (15.4%, a difference of 0.62%). Similarly, the demographic groups most similar to Immigrants from Fiji are Immigrants from Hungary (15.7%, a difference of 0.11%), Slavic (15.7%, a difference of 0.19%), Immigrants from Kuwait (15.6%, a difference of 0.45%), Albanian (15.6%, a difference of 0.68%), and Immigrants from Southern Europe (15.6%, a difference of 0.69%).
| Demographics | Rating | Rank | Child Poverty Among Boys Under 16 |
| Immigrants | Norway | 92.3 /100 | #123 | Exceptional 15.3% |
| Tlingit-Haida | 92.2 /100 | #124 | Exceptional 15.3% |
| Czechoslovakians | 92.1 /100 | #125 | Exceptional 15.3% |
| Palestinians | 91.3 /100 | #126 | Exceptional 15.4% |
| Carpatho Rusyns | 91.1 /100 | #127 | Exceptional 15.4% |
| Canadians | 90.6 /100 | #128 | Exceptional 15.4% |
| Immigrants | Brazil | 90.3 /100 | #129 | Exceptional 15.4% |
| Mongolians | 90.2 /100 | #130 | Exceptional 15.4% |
| Immigrants | Western Europe | 90.0 /100 | #131 | Exceptional 15.4% |
| Immigrants | Kazakhstan | 88.7 /100 | #132 | Excellent 15.5% |
| Welsh | 88.3 /100 | #133 | Excellent 15.5% |
| Peruvians | 88.1 /100 | #134 | Excellent 15.5% |
| Portuguese | 87.5 /100 | #135 | Excellent 15.5% |
| Icelanders | 87.5 /100 | #136 | Excellent 15.5% |
| Immigrants | Spain | 87.1 /100 | #137 | Excellent 15.6% |
| Immigrants | Southern Europe | 86.5 /100 | #138 | Excellent 15.6% |
| Albanians | 86.5 /100 | #139 | Excellent 15.6% |
| Immigrants | Kuwait | 85.6 /100 | #140 | Excellent 15.6% |
| Slavs | 84.5 /100 | #141 | Excellent 15.7% |
| Immigrants | Hungary | 84.1 /100 | #142 | Excellent 15.7% |
| Immigrants | Fiji | 83.6 /100 | #143 | Excellent 15.7% |