Tlingit-Haida vs Moroccan Child Poverty Among Boys Under 16
COMPARE
Tlingit-Haida
Moroccan
Child Poverty Among Boys Under 16
Child Poverty Among Boys Under 16 Comparison
Tlingit-Haida
Moroccans
15.3%
CHILD POVERTY AMONG BOYS UNDER 16
92.2/ 100
METRIC RATING
124th/ 347
METRIC RANK
17.7%
CHILD POVERTY AMONG BOYS UNDER 16
5.6/ 100
METRIC RATING
216th/ 347
METRIC RANK
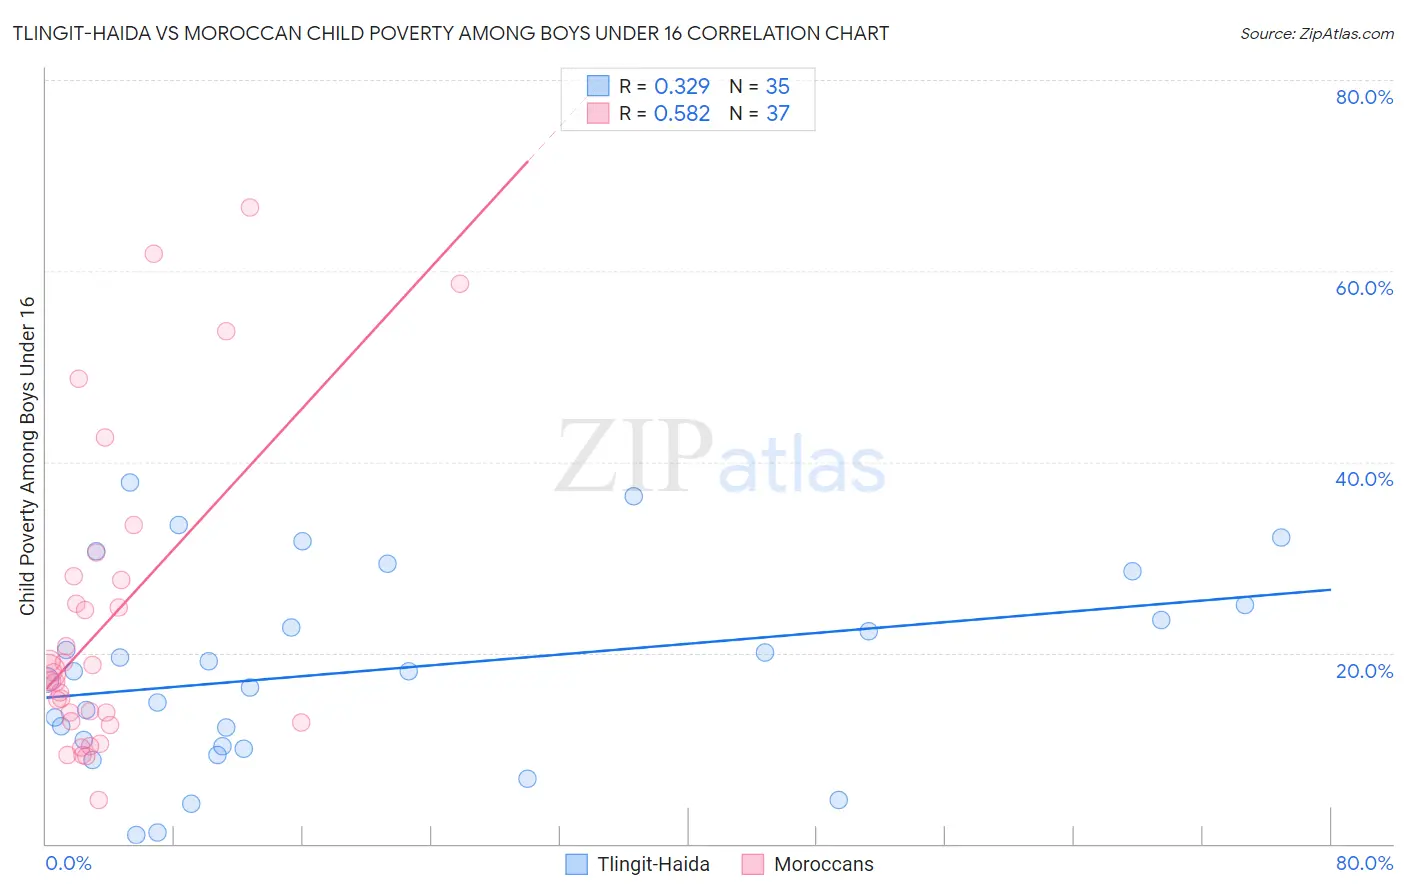
Tlingit-Haida vs Moroccan Child Poverty Among Boys Under 16 Correlation Chart
The statistical analysis conducted on geographies consisting of 60,443,448 people shows a mild positive correlation between the proportion of Tlingit-Haida and poverty level among boys under the age of 16 in the United States with a correlation coefficient (R) of 0.329 and weighted average of 15.3%. Similarly, the statistical analysis conducted on geographies consisting of 200,157,995 people shows a substantial positive correlation between the proportion of Moroccans and poverty level among boys under the age of 16 in the United States with a correlation coefficient (R) of 0.582 and weighted average of 17.7%, a difference of 15.9%.
Child Poverty Among Boys Under 16 Correlation Summary
| Measurement | Tlingit-Haida | Moroccan |
| Minimum | 0.92% | 4.6% |
| Maximum | 37.8% | 66.7% |
| Range | 36.9% | 62.1% |
| Mean | 18.1% | 23.3% |
| Median | 18.0% | 17.9% |
| Interquartile 25% (IQ1) | 10.2% | 12.8% |
| Interquartile 75% (IQ3) | 25.0% | 27.8% |
| Interquartile Range (IQR) | 14.8% | 15.1% |
| Standard Deviation (Sample) | 10.0% | 16.0% |
| Standard Deviation (Population) | 9.9% | 15.8% |
Similar Demographics by Child Poverty Among Boys Under 16
Demographics Similar to Tlingit-Haida by Child Poverty Among Boys Under 16
In terms of child poverty among boys under 16, the demographic groups most similar to Tlingit-Haida are Immigrants from Norway (15.3%, a difference of 0.010%), Czechoslovakian (15.3%, a difference of 0.070%), Immigrants from Malaysia (15.3%, a difference of 0.23%), Scottish (15.2%, a difference of 0.33%), and South African (15.2%, a difference of 0.34%).
| Demographics | Rating | Rank | Child Poverty Among Boys Under 16 |
| Immigrants | Vietnam | 93.5 /100 | #117 | Exceptional 15.2% |
| Native Hawaiians | 93.4 /100 | #118 | Exceptional 15.2% |
| Belgians | 93.1 /100 | #119 | Exceptional 15.2% |
| South Africans | 93.0 /100 | #120 | Exceptional 15.2% |
| Scottish | 93.0 /100 | #121 | Exceptional 15.2% |
| Immigrants | Malaysia | 92.8 /100 | #122 | Exceptional 15.3% |
| Immigrants | Norway | 92.3 /100 | #123 | Exceptional 15.3% |
| Tlingit-Haida | 92.2 /100 | #124 | Exceptional 15.3% |
| Czechoslovakians | 92.1 /100 | #125 | Exceptional 15.3% |
| Palestinians | 91.3 /100 | #126 | Exceptional 15.4% |
| Carpatho Rusyns | 91.1 /100 | #127 | Exceptional 15.4% |
| Canadians | 90.6 /100 | #128 | Exceptional 15.4% |
| Immigrants | Brazil | 90.3 /100 | #129 | Exceptional 15.4% |
| Mongolians | 90.2 /100 | #130 | Exceptional 15.4% |
| Immigrants | Western Europe | 90.0 /100 | #131 | Exceptional 15.4% |
Demographics Similar to Moroccans by Child Poverty Among Boys Under 16
In terms of child poverty among boys under 16, the demographic groups most similar to Moroccans are Japanese (17.7%, a difference of 0.030%), Iraqi (17.7%, a difference of 0.050%), Osage (17.7%, a difference of 0.090%), Sierra Leonean (17.8%, a difference of 0.13%), and Panamanian (17.7%, a difference of 0.16%).
| Demographics | Rating | Rank | Child Poverty Among Boys Under 16 |
| Alaskan Athabascans | 7.3 /100 | #209 | Tragic 17.6% |
| Immigrants | Armenia | 6.8 /100 | #210 | Tragic 17.6% |
| Immigrants | Immigrants | 6.7 /100 | #211 | Tragic 17.6% |
| Aleuts | 6.6 /100 | #212 | Tragic 17.7% |
| Immigrants | Eastern Africa | 6.0 /100 | #213 | Tragic 17.7% |
| Panamanians | 5.9 /100 | #214 | Tragic 17.7% |
| Osage | 5.8 /100 | #215 | Tragic 17.7% |
| Moroccans | 5.6 /100 | #216 | Tragic 17.7% |
| Japanese | 5.5 /100 | #217 | Tragic 17.7% |
| Iraqis | 5.5 /100 | #218 | Tragic 17.7% |
| Sierra Leoneans | 5.3 /100 | #219 | Tragic 17.8% |
| Immigrants | Cambodia | 5.1 /100 | #220 | Tragic 17.8% |
| Immigrants | Panama | 4.3 /100 | #221 | Tragic 17.9% |
| Pennsylvania Germans | 3.9 /100 | #222 | Tragic 17.9% |
| Cubans | 3.8 /100 | #223 | Tragic 17.9% |