White/Caucasian vs African Child Poverty Among Boys Under 16
COMPARE
White/Caucasian
African
Child Poverty Among Boys Under 16
Child Poverty Among Boys Under 16 Comparison
Whites/Caucasians
Africans
16.5%
CHILD POVERTY AMONG BOYS UNDER 16
48.2/ 100
METRIC RATING
176th/ 347
METRIC RANK
21.7%
CHILD POVERTY AMONG BOYS UNDER 16
0.0/ 100
METRIC RATING
317th/ 347
METRIC RANK
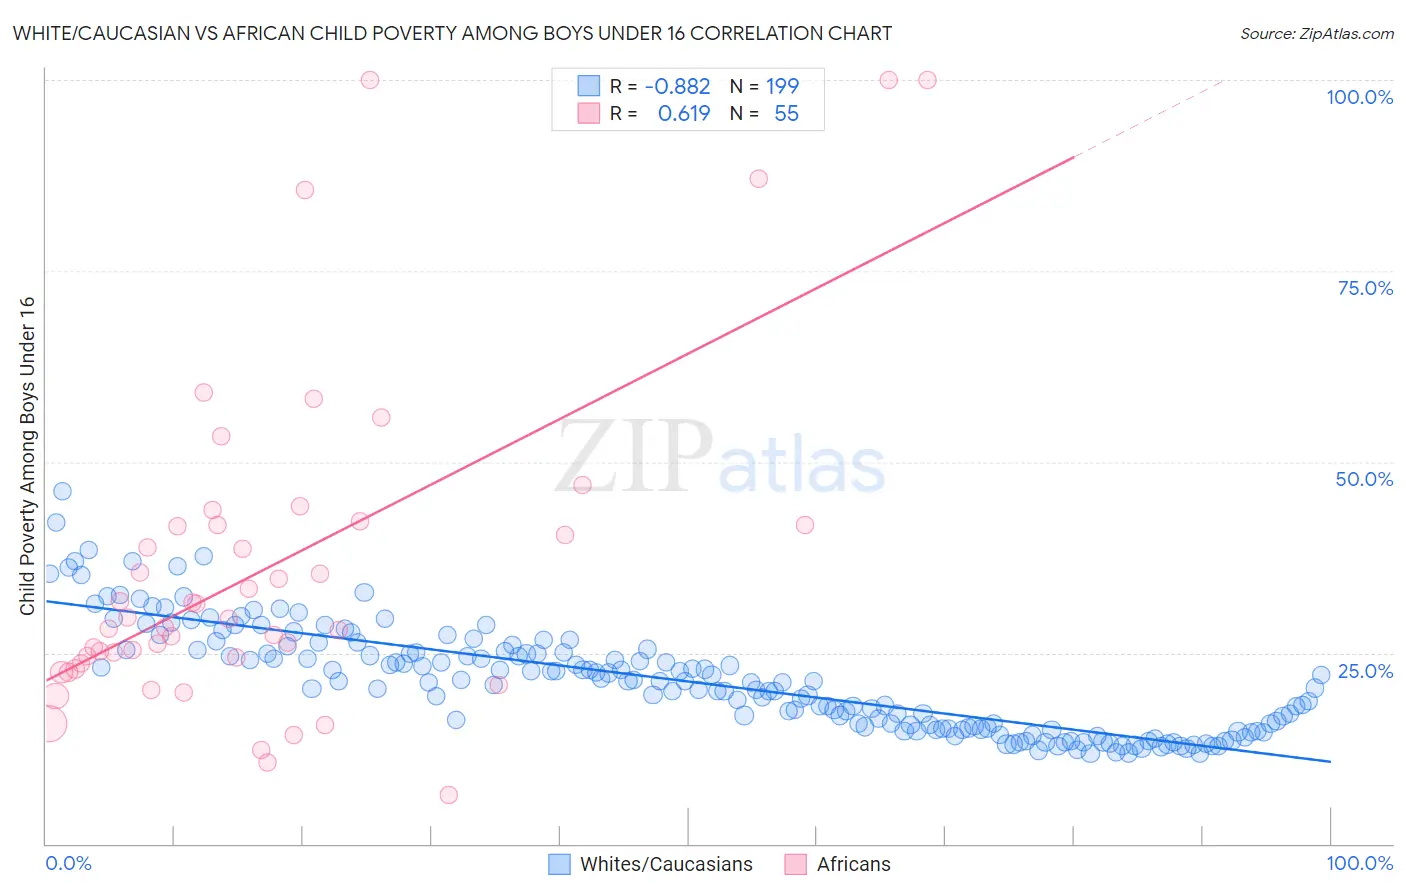
White/Caucasian vs African Child Poverty Among Boys Under 16 Correlation Chart
The statistical analysis conducted on geographies consisting of 560,435,427 people shows a very strong negative correlation between the proportion of Whites/Caucasians and poverty level among boys under the age of 16 in the United States with a correlation coefficient (R) of -0.882 and weighted average of 16.5%. Similarly, the statistical analysis conducted on geographies consisting of 463,090,980 people shows a significant positive correlation between the proportion of Africans and poverty level among boys under the age of 16 in the United States with a correlation coefficient (R) of 0.619 and weighted average of 21.7%, a difference of 32.0%.
Child Poverty Among Boys Under 16 Correlation Summary
| Measurement | White/Caucasian | African |
| Minimum | 11.8% | 6.5% |
| Maximum | 46.2% | 100.0% |
| Range | 34.4% | 93.5% |
| Mean | 21.3% | 36.4% |
| Median | 21.2% | 29.5% |
| Interquartile 25% (IQ1) | 15.1% | 23.6% |
| Interquartile 75% (IQ3) | 25.3% | 41.7% |
| Interquartile Range (IQR) | 10.2% | 18.1% |
| Standard Deviation (Sample) | 6.9% | 21.9% |
| Standard Deviation (Population) | 6.9% | 21.7% |
Similar Demographics by Child Poverty Among Boys Under 16
Demographics Similar to Whites/Caucasians by Child Poverty Among Boys Under 16
In terms of child poverty among boys under 16, the demographic groups most similar to Whites/Caucasians are Ethiopian (16.5%, a difference of 0.040%), Scotch-Irish (16.5%, a difference of 0.080%), Immigrants from Syria (16.5%, a difference of 0.090%), Hungarian (16.5%, a difference of 0.10%), and Uruguayan (16.4%, a difference of 0.20%).
| Demographics | Rating | Rank | Child Poverty Among Boys Under 16 |
| Immigrants | Saudi Arabia | 53.6 /100 | #169 | Average 16.4% |
| Immigrants | Bosnia and Herzegovina | 51.7 /100 | #170 | Average 16.4% |
| Immigrants | Ethiopia | 51.3 /100 | #171 | Average 16.4% |
| Immigrants | Colombia | 50.8 /100 | #172 | Average 16.4% |
| Tsimshian | 50.5 /100 | #173 | Average 16.4% |
| Uruguayans | 50.0 /100 | #174 | Average 16.4% |
| Immigrants | Syria | 49.0 /100 | #175 | Average 16.5% |
| Whites/Caucasians | 48.2 /100 | #176 | Average 16.5% |
| Ethiopians | 47.8 /100 | #177 | Average 16.5% |
| Scotch-Irish | 47.5 /100 | #178 | Average 16.5% |
| Hungarians | 47.3 /100 | #179 | Average 16.5% |
| Hawaiians | 45.5 /100 | #180 | Average 16.5% |
| South American Indians | 44.3 /100 | #181 | Average 16.5% |
| Lebanese | 43.3 /100 | #182 | Average 16.6% |
| Kenyans | 41.0 /100 | #183 | Average 16.6% |
Demographics Similar to Africans by Child Poverty Among Boys Under 16
In terms of child poverty among boys under 16, the demographic groups most similar to Africans are Yakama (21.7%, a difference of 0.060%), Menominee (21.7%, a difference of 0.080%), Immigrants from Somalia (21.7%, a difference of 0.090%), Dutch West Indian (21.8%, a difference of 0.54%), and Ute (21.6%, a difference of 0.69%).
| Demographics | Rating | Rank | Child Poverty Among Boys Under 16 |
| Creek | 0.0 /100 | #310 | Tragic 21.5% |
| Bahamians | 0.0 /100 | #311 | Tragic 21.6% |
| Immigrants | Guatemala | 0.0 /100 | #312 | Tragic 21.6% |
| British West Indians | 0.0 /100 | #313 | Tragic 21.6% |
| Ute | 0.0 /100 | #314 | Tragic 21.6% |
| Immigrants | Somalia | 0.0 /100 | #315 | Tragic 21.7% |
| Menominee | 0.0 /100 | #316 | Tragic 21.7% |
| Africans | 0.0 /100 | #317 | Tragic 21.7% |
| Yakama | 0.0 /100 | #318 | Tragic 21.7% |
| Dutch West Indians | 0.0 /100 | #319 | Tragic 21.8% |
| U.S. Virgin Islanders | 0.0 /100 | #320 | Tragic 22.0% |
| Cajuns | 0.0 /100 | #321 | Tragic 22.2% |
| Immigrants | Dominica | 0.0 /100 | #322 | Tragic 22.2% |
| Hondurans | 0.0 /100 | #323 | Tragic 22.3% |
| Immigrants | Congo | 0.0 /100 | #324 | Tragic 22.4% |