Taiwanese vs Palestinian Householder Income Over 65 years
COMPARE
Taiwanese
Palestinian
Householder Income Over 65 years
Householder Income Over 65 years Comparison
Taiwanese
Palestinians
$62,894
HOUSEHOLDER INCOME OVER 65 YEARS
88.3/ 100
METRIC RATING
124th/ 347
METRIC RANK
$63,800
HOUSEHOLDER INCOME OVER 65 YEARS
95.1/ 100
METRIC RATING
108th/ 347
METRIC RANK
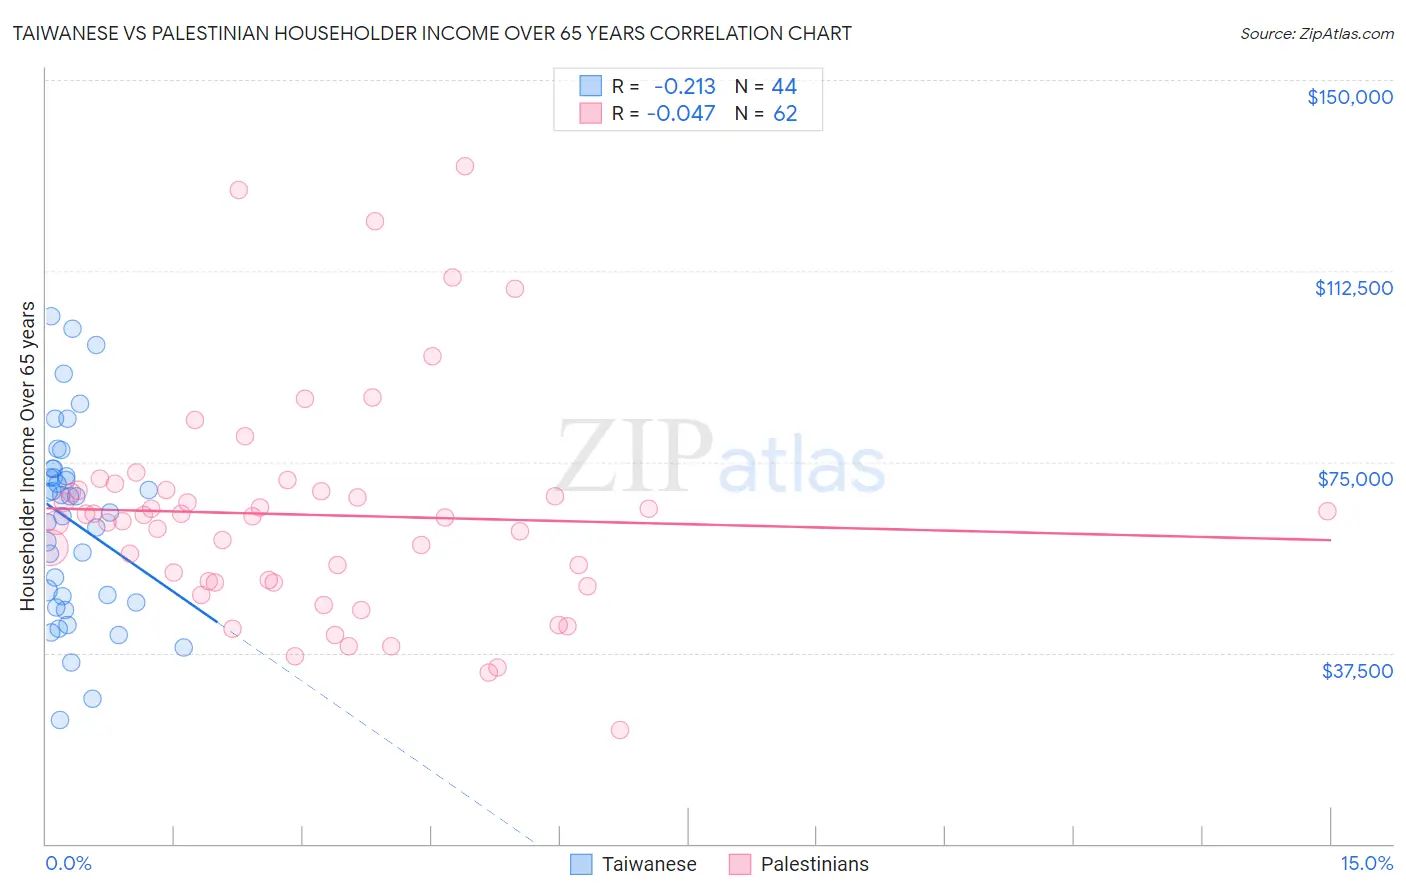
Taiwanese vs Palestinian Householder Income Over 65 years Correlation Chart
The statistical analysis conducted on geographies consisting of 31,709,765 people shows a weak negative correlation between the proportion of Taiwanese and household income with householder over the age of 65 in the United States with a correlation coefficient (R) of -0.213 and weighted average of $62,894. Similarly, the statistical analysis conducted on geographies consisting of 216,153,975 people shows no correlation between the proportion of Palestinians and household income with householder over the age of 65 in the United States with a correlation coefficient (R) of -0.047 and weighted average of $63,800, a difference of 1.4%.
Householder Income Over 65 years Correlation Summary
| Measurement | Taiwanese | Palestinian |
| Minimum | $24,327 | $22,303 |
| Maximum | $103,672 | $133,182 |
| Range | $79,345 | $110,879 |
| Mean | $63,260 | $64,585 |
| Median | $66,674 | $64,219 |
| Interquartile 25% (IQ1) | $48,016 | $51,418 |
| Interquartile 75% (IQ3) | $72,850 | $69,430 |
| Interquartile Range (IQR) | $24,834 | $18,012 |
| Standard Deviation (Sample) | $18,817 | $21,891 |
| Standard Deviation (Population) | $18,602 | $21,714 |
Demographics Similar to Taiwanese and Palestinians by Householder Income Over 65 years
In terms of householder income over 65 years, the demographic groups most similar to Taiwanese are Tlingit-Haida ($62,922, a difference of 0.040%), Immigrants from Moldova ($62,939, a difference of 0.070%), Soviet Union ($62,848, a difference of 0.070%), Immigrants from Vietnam ($63,014, a difference of 0.19%), and Peruvian ($62,766, a difference of 0.20%). Similarly, the demographic groups most similar to Palestinians are European ($63,779, a difference of 0.030%), Pakistani ($63,844, a difference of 0.070%), Immigrants from Argentina ($63,885, a difference of 0.13%), Immigrants from Zimbabwe ($63,643, a difference of 0.25%), and Immigrants from Spain ($63,540, a difference of 0.41%).
| Demographics | Rating | Rank | Householder Income Over 65 years |
| Immigrants | Argentina | 95.5 /100 | #106 | Exceptional $63,885 |
| Pakistanis | 95.3 /100 | #107 | Exceptional $63,844 |
| Palestinians | 95.1 /100 | #108 | Exceptional $63,800 |
| Europeans | 95.0 /100 | #109 | Exceptional $63,779 |
| Immigrants | Zimbabwe | 94.3 /100 | #110 | Exceptional $63,643 |
| Immigrants | Spain | 93.7 /100 | #111 | Exceptional $63,540 |
| Syrians | 93.4 /100 | #112 | Exceptional $63,494 |
| Immigrants | Serbia | 92.7 /100 | #113 | Exceptional $63,387 |
| Immigrants | Saudi Arabia | 92.4 /100 | #114 | Exceptional $63,355 |
| Croatians | 91.4 /100 | #115 | Exceptional $63,225 |
| Guamanians/Chamorros | 91.1 /100 | #116 | Exceptional $63,187 |
| Immigrants | Croatia | 90.9 /100 | #117 | Exceptional $63,168 |
| Danes | 90.5 /100 | #118 | Exceptional $63,117 |
| Immigrants | Jordan | 89.8 /100 | #119 | Excellent $63,041 |
| Ukrainians | 89.7 /100 | #120 | Excellent $63,032 |
| Immigrants | Vietnam | 89.5 /100 | #121 | Excellent $63,014 |
| Immigrants | Moldova | 88.7 /100 | #122 | Excellent $62,939 |
| Tlingit-Haida | 88.6 /100 | #123 | Excellent $62,922 |
| Taiwanese | 88.3 /100 | #124 | Excellent $62,894 |
| Soviet Union | 87.8 /100 | #125 | Excellent $62,848 |
| Peruvians | 86.8 /100 | #126 | Excellent $62,766 |