Taiwanese vs Assyrian/Chaldean/Syriac Single Female Poverty
COMPARE
Taiwanese
Assyrian/Chaldean/Syriac
Single Female Poverty
Single Female Poverty Comparison
Taiwanese
Assyrians/Chaldeans/Syriacs
19.4%
SINGLE FEMALE POVERTY
99.2/ 100
METRIC RATING
83rd/ 347
METRIC RANK
17.0%
SINGLE FEMALE POVERTY
100.0/ 100
METRIC RATING
5th/ 347
METRIC RANK
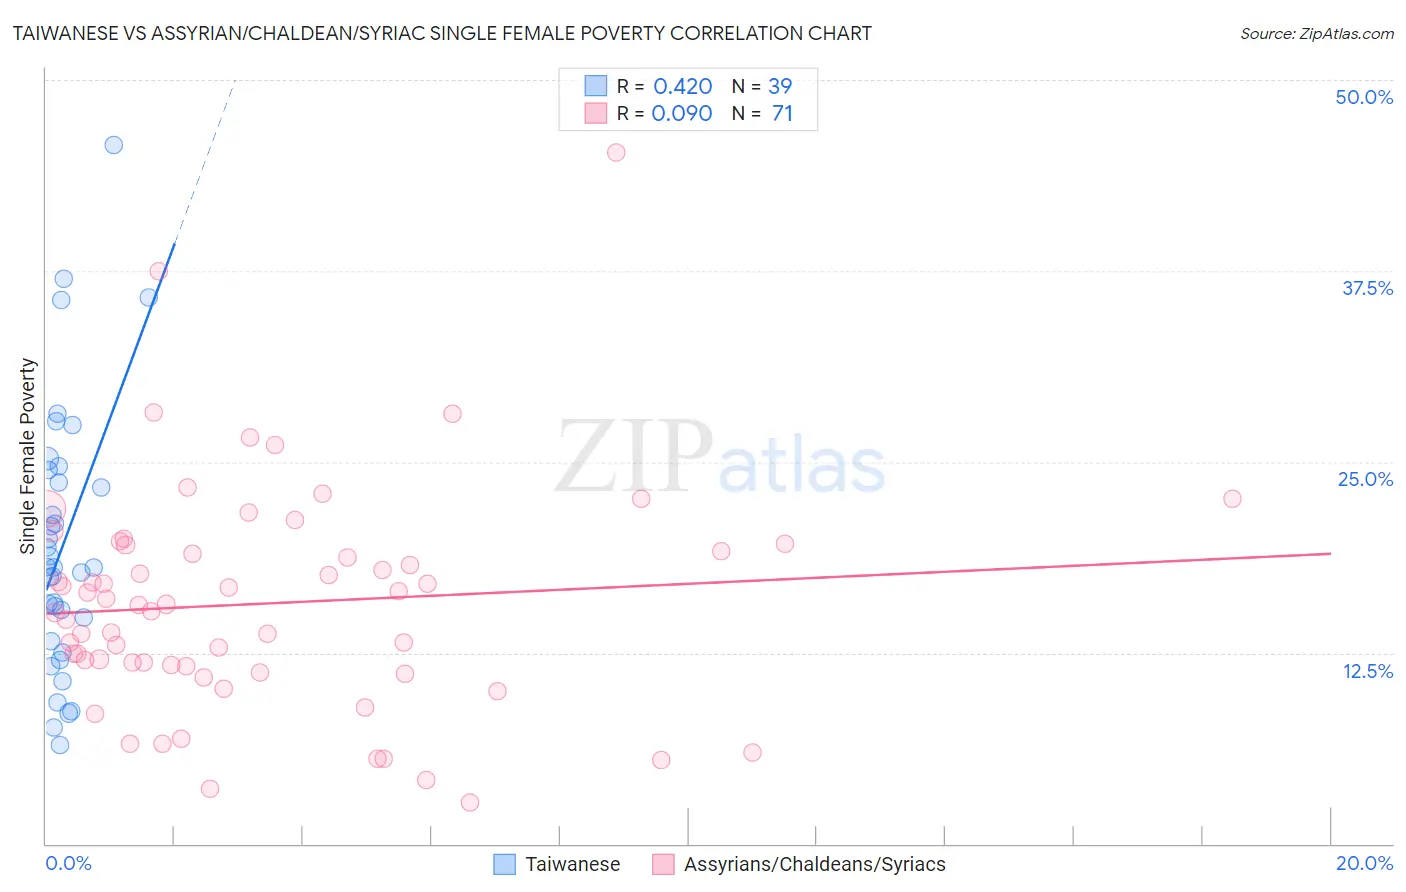
Taiwanese vs Assyrian/Chaldean/Syriac Single Female Poverty Correlation Chart
The statistical analysis conducted on geographies consisting of 31,618,810 people shows a moderate positive correlation between the proportion of Taiwanese and poverty level among single females in the United States with a correlation coefficient (R) of 0.420 and weighted average of 19.4%. Similarly, the statistical analysis conducted on geographies consisting of 109,756,092 people shows a slight positive correlation between the proportion of Assyrians/Chaldeans/Syriacs and poverty level among single females in the United States with a correlation coefficient (R) of 0.090 and weighted average of 17.0%, a difference of 14.5%.
Single Female Poverty Correlation Summary
| Measurement | Taiwanese | Assyrian/Chaldean/Syriac |
| Minimum | 6.5% | 2.7% |
| Maximum | 45.7% | 45.3% |
| Range | 39.3% | 42.5% |
| Mean | 19.6% | 15.7% |
| Median | 18.1% | 15.6% |
| Interquartile 25% (IQ1) | 13.2% | 11.7% |
| Interquartile 75% (IQ3) | 24.5% | 19.6% |
| Interquartile Range (IQR) | 11.2% | 7.9% |
| Standard Deviation (Sample) | 8.7% | 7.4% |
| Standard Deviation (Population) | 8.6% | 7.3% |
Similar Demographics by Single Female Poverty
Demographics Similar to Taiwanese by Single Female Poverty
In terms of single female poverty, the demographic groups most similar to Taiwanese are Immigrants from Malaysia (19.4%, a difference of 0.010%), Immigrants from Scotland (19.4%, a difference of 0.020%), Immigrants from Australia (19.4%, a difference of 0.050%), Immigrants from Sierra Leone (19.4%, a difference of 0.080%), and Immigrants from Sweden (19.4%, a difference of 0.080%).
| Demographics | Rating | Rank | Single Female Poverty |
| Peruvians | 99.4 /100 | #76 | Exceptional 19.4% |
| Immigrants | Russia | 99.3 /100 | #77 | Exceptional 19.4% |
| Albanians | 99.3 /100 | #78 | Exceptional 19.4% |
| Immigrants | Sierra Leone | 99.3 /100 | #79 | Exceptional 19.4% |
| Immigrants | Australia | 99.3 /100 | #80 | Exceptional 19.4% |
| Immigrants | Scotland | 99.2 /100 | #81 | Exceptional 19.4% |
| Immigrants | Malaysia | 99.2 /100 | #82 | Exceptional 19.4% |
| Taiwanese | 99.2 /100 | #83 | Exceptional 19.4% |
| Immigrants | Sweden | 99.2 /100 | #84 | Exceptional 19.4% |
| Immigrants | Albania | 99.2 /100 | #85 | Exceptional 19.4% |
| Greeks | 99.2 /100 | #86 | Exceptional 19.4% |
| Zimbabweans | 99.0 /100 | #87 | Exceptional 19.5% |
| Afghans | 99.0 /100 | #88 | Exceptional 19.5% |
| Immigrants | Ukraine | 99.0 /100 | #89 | Exceptional 19.5% |
| Immigrants | Lebanon | 98.8 /100 | #90 | Exceptional 19.6% |
Demographics Similar to Assyrians/Chaldeans/Syriacs by Single Female Poverty
In terms of single female poverty, the demographic groups most similar to Assyrians/Chaldeans/Syriacs are Filipino (17.0%, a difference of 0.20%), Immigrants from India (16.8%, a difference of 0.83%), Thai (17.3%, a difference of 1.9%), Immigrants from Hong Kong (16.5%, a difference of 2.6%), and Immigrants from Iran (17.5%, a difference of 3.0%).
| Demographics | Rating | Rank | Single Female Poverty |
| Chinese | 100.0 /100 | #1 | Exceptional 16.1% |
| Immigrants | Taiwan | 100.0 /100 | #2 | Exceptional 16.4% |
| Immigrants | Hong Kong | 100.0 /100 | #3 | Exceptional 16.5% |
| Immigrants | India | 100.0 /100 | #4 | Exceptional 16.8% |
| Assyrians/Chaldeans/Syriacs | 100.0 /100 | #5 | Exceptional 17.0% |
| Filipinos | 100.0 /100 | #6 | Exceptional 17.0% |
| Thais | 100.0 /100 | #7 | Exceptional 17.3% |
| Immigrants | Iran | 100.0 /100 | #8 | Exceptional 17.5% |
| Bhutanese | 100.0 /100 | #9 | Exceptional 17.7% |
| Immigrants | Ireland | 100.0 /100 | #10 | Exceptional 17.8% |
| Immigrants | Lithuania | 100.0 /100 | #11 | Exceptional 17.8% |
| Immigrants | South Central Asia | 100.0 /100 | #12 | Exceptional 17.8% |
| Immigrants | Bolivia | 100.0 /100 | #13 | Exceptional 17.8% |
| Bolivians | 100.0 /100 | #14 | Exceptional 17.9% |
| Indians (Asian) | 100.0 /100 | #15 | Exceptional 17.9% |