Taiwanese vs Venezuelan Single Female Poverty
COMPARE
Taiwanese
Venezuelan
Single Female Poverty
Single Female Poverty Comparison
Taiwanese
Venezuelans
19.4%
SINGLE FEMALE POVERTY
99.2/ 100
METRIC RATING
83rd/ 347
METRIC RANK
20.4%
SINGLE FEMALE POVERTY
85.5/ 100
METRIC RATING
146th/ 347
METRIC RANK
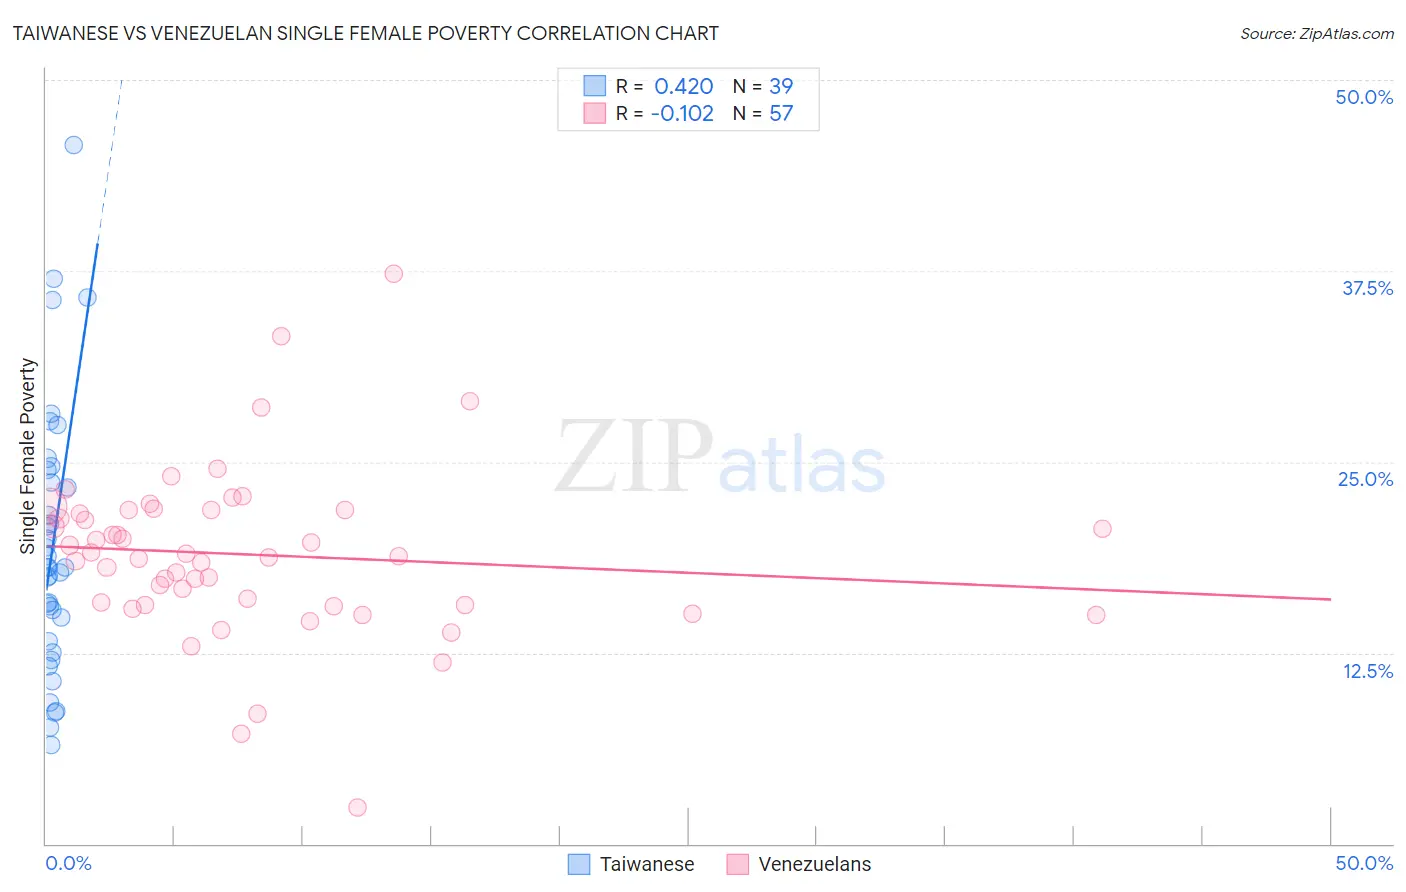
Taiwanese vs Venezuelan Single Female Poverty Correlation Chart
The statistical analysis conducted on geographies consisting of 31,618,810 people shows a moderate positive correlation between the proportion of Taiwanese and poverty level among single females in the United States with a correlation coefficient (R) of 0.420 and weighted average of 19.4%. Similarly, the statistical analysis conducted on geographies consisting of 303,310,735 people shows a poor negative correlation between the proportion of Venezuelans and poverty level among single females in the United States with a correlation coefficient (R) of -0.102 and weighted average of 20.4%, a difference of 5.2%.
Single Female Poverty Correlation Summary
| Measurement | Taiwanese | Venezuelan |
| Minimum | 6.5% | 2.3% |
| Maximum | 45.7% | 37.3% |
| Range | 39.3% | 35.0% |
| Mean | 19.6% | 18.9% |
| Median | 18.1% | 18.8% |
| Interquartile 25% (IQ1) | 13.2% | 15.6% |
| Interquartile 75% (IQ3) | 24.5% | 21.8% |
| Interquartile Range (IQR) | 11.2% | 6.2% |
| Standard Deviation (Sample) | 8.7% | 5.6% |
| Standard Deviation (Population) | 8.6% | 5.5% |
Similar Demographics by Single Female Poverty
Demographics Similar to Taiwanese by Single Female Poverty
In terms of single female poverty, the demographic groups most similar to Taiwanese are Immigrants from Malaysia (19.4%, a difference of 0.010%), Immigrants from Scotland (19.4%, a difference of 0.020%), Immigrants from Australia (19.4%, a difference of 0.050%), Immigrants from Sierra Leone (19.4%, a difference of 0.080%), and Immigrants from Sweden (19.4%, a difference of 0.080%).
| Demographics | Rating | Rank | Single Female Poverty |
| Peruvians | 99.4 /100 | #76 | Exceptional 19.4% |
| Immigrants | Russia | 99.3 /100 | #77 | Exceptional 19.4% |
| Albanians | 99.3 /100 | #78 | Exceptional 19.4% |
| Immigrants | Sierra Leone | 99.3 /100 | #79 | Exceptional 19.4% |
| Immigrants | Australia | 99.3 /100 | #80 | Exceptional 19.4% |
| Immigrants | Scotland | 99.2 /100 | #81 | Exceptional 19.4% |
| Immigrants | Malaysia | 99.2 /100 | #82 | Exceptional 19.4% |
| Taiwanese | 99.2 /100 | #83 | Exceptional 19.4% |
| Immigrants | Sweden | 99.2 /100 | #84 | Exceptional 19.4% |
| Immigrants | Albania | 99.2 /100 | #85 | Exceptional 19.4% |
| Greeks | 99.2 /100 | #86 | Exceptional 19.4% |
| Zimbabweans | 99.0 /100 | #87 | Exceptional 19.5% |
| Afghans | 99.0 /100 | #88 | Exceptional 19.5% |
| Immigrants | Ukraine | 99.0 /100 | #89 | Exceptional 19.5% |
| Immigrants | Lebanon | 98.8 /100 | #90 | Exceptional 19.6% |
Demographics Similar to Venezuelans by Single Female Poverty
In terms of single female poverty, the demographic groups most similar to Venezuelans are Austrian (20.4%, a difference of 0.030%), South African (20.4%, a difference of 0.030%), Luxembourger (20.4%, a difference of 0.080%), Immigrants from Uzbekistan (20.3%, a difference of 0.39%), and Australian (20.3%, a difference of 0.40%).
| Demographics | Rating | Rank | Single Female Poverty |
| Immigrants | Kuwait | 90.4 /100 | #139 | Exceptional 20.3% |
| Syrians | 90.4 /100 | #140 | Exceptional 20.3% |
| Immigrants | North America | 89.5 /100 | #141 | Excellent 20.3% |
| Immigrants | Uganda | 89.1 /100 | #142 | Excellent 20.3% |
| Australians | 88.4 /100 | #143 | Excellent 20.3% |
| Immigrants | Uzbekistan | 88.3 /100 | #144 | Excellent 20.3% |
| Austrians | 85.8 /100 | #145 | Excellent 20.4% |
| Venezuelans | 85.5 /100 | #146 | Excellent 20.4% |
| South Africans | 85.3 /100 | #147 | Excellent 20.4% |
| Luxembourgers | 84.9 /100 | #148 | Excellent 20.4% |
| Portuguese | 81.5 /100 | #149 | Excellent 20.5% |
| Immigrants | Denmark | 80.5 /100 | #150 | Excellent 20.5% |
| Puget Sound Salish | 79.6 /100 | #151 | Good 20.6% |
| Immigrants | Uruguay | 77.7 /100 | #152 | Good 20.6% |
| Swedes | 77.1 /100 | #153 | Good 20.6% |