Taiwanese vs Immigrants from Africa Married-Couple Family Poverty
COMPARE
Taiwanese
Immigrants from Africa
Married-Couple Family Poverty
Married-Couple Family Poverty Comparison
Taiwanese
Immigrants from Africa
4.8%
MARRIED-COUPLE FAMILY POVERTY
94.8/ 100
METRIC RATING
115th/ 347
METRIC RANK
5.5%
MARRIED-COUPLE FAMILY POVERTY
17.6/ 100
METRIC RATING
207th/ 347
METRIC RANK
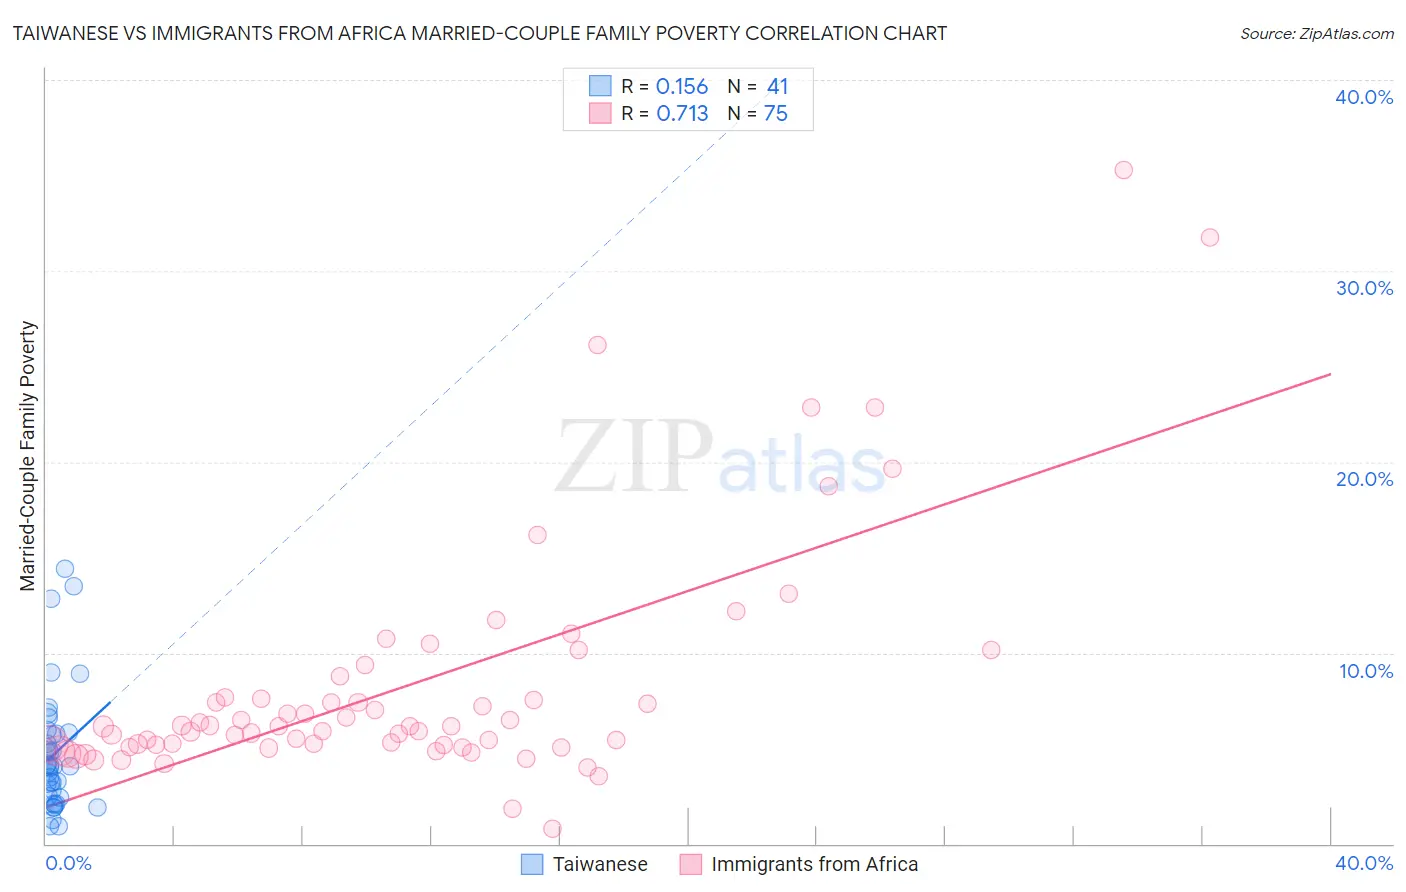
Taiwanese vs Immigrants from Africa Married-Couple Family Poverty Correlation Chart
The statistical analysis conducted on geographies consisting of 31,702,060 people shows a poor positive correlation between the proportion of Taiwanese and poverty level among married-couple families in the United States with a correlation coefficient (R) of 0.156 and weighted average of 4.8%. Similarly, the statistical analysis conducted on geographies consisting of 463,705,705 people shows a strong positive correlation between the proportion of Immigrants from Africa and poverty level among married-couple families in the United States with a correlation coefficient (R) of 0.713 and weighted average of 5.5%, a difference of 14.1%.
Married-Couple Family Poverty Correlation Summary
| Measurement | Taiwanese | Immigrants from Africa |
| Minimum | 0.94% | 0.82% |
| Maximum | 14.4% | 35.3% |
| Range | 13.5% | 34.5% |
| Mean | 4.7% | 8.3% |
| Median | 4.1% | 6.1% |
| Interquartile 25% (IQ1) | 2.4% | 5.2% |
| Interquartile 75% (IQ3) | 5.8% | 7.6% |
| Interquartile Range (IQR) | 3.3% | 2.5% |
| Standard Deviation (Sample) | 3.2% | 6.3% |
| Standard Deviation (Population) | 3.1% | 6.2% |
Similar Demographics by Married-Couple Family Poverty
Demographics Similar to Taiwanese by Married-Couple Family Poverty
In terms of married-couple family poverty, the demographic groups most similar to Taiwanese are Celtic (4.8%, a difference of 0.010%), Kenyan (4.8%, a difference of 0.11%), Immigrants from Philippines (4.8%, a difference of 0.13%), Immigrants from Indonesia (4.8%, a difference of 0.15%), and Immigrants from Eastern Asia (4.8%, a difference of 0.50%).
| Demographics | Rating | Rank | Married-Couple Family Poverty |
| Laotians | 96.6 /100 | #108 | Exceptional 4.7% |
| Immigrants | Hong Kong | 96.4 /100 | #109 | Exceptional 4.7% |
| Immigrants | Bolivia | 96.2 /100 | #110 | Exceptional 4.7% |
| Pakistanis | 96.2 /100 | #111 | Exceptional 4.7% |
| Tongans | 95.9 /100 | #112 | Exceptional 4.7% |
| Immigrants | Nepal | 95.9 /100 | #113 | Exceptional 4.7% |
| Immigrants | Indonesia | 95.1 /100 | #114 | Exceptional 4.8% |
| Taiwanese | 94.8 /100 | #115 | Exceptional 4.8% |
| Celtics | 94.8 /100 | #116 | Exceptional 4.8% |
| Kenyans | 94.7 /100 | #117 | Exceptional 4.8% |
| Immigrants | Philippines | 94.6 /100 | #118 | Exceptional 4.8% |
| Immigrants | Eastern Asia | 94.0 /100 | #119 | Exceptional 4.8% |
| Immigrants | Southern Europe | 93.4 /100 | #120 | Exceptional 4.8% |
| Indians (Asian) | 93.2 /100 | #121 | Exceptional 4.8% |
| Whites/Caucasians | 93.1 /100 | #122 | Exceptional 4.8% |
Demographics Similar to Immigrants from Africa by Married-Couple Family Poverty
In terms of married-couple family poverty, the demographic groups most similar to Immigrants from Africa are Osage (5.4%, a difference of 0.14%), Chippewa (5.4%, a difference of 0.24%), French American Indian (5.5%, a difference of 0.32%), Immigrants from Costa Rica (5.4%, a difference of 0.33%), and Immigrants from Syria (5.5%, a difference of 0.46%).
| Demographics | Rating | Rank | Married-Couple Family Poverty |
| Immigrants | Morocco | 24.3 /100 | #200 | Fair 5.4% |
| Lebanese | 24.1 /100 | #201 | Fair 5.4% |
| Immigrants | Middle Africa | 23.8 /100 | #202 | Fair 5.4% |
| Immigrants | Peru | 21.8 /100 | #203 | Fair 5.4% |
| Immigrants | Costa Rica | 19.4 /100 | #204 | Poor 5.4% |
| Chippewa | 18.9 /100 | #205 | Poor 5.4% |
| Osage | 18.4 /100 | #206 | Poor 5.4% |
| Immigrants | Africa | 17.6 /100 | #207 | Poor 5.5% |
| French American Indians | 16.1 /100 | #208 | Poor 5.5% |
| Immigrants | Syria | 15.4 /100 | #209 | Poor 5.5% |
| Immigrants | Micronesia | 14.4 /100 | #210 | Poor 5.5% |
| Nigerians | 14.3 /100 | #211 | Poor 5.5% |
| Immigrants | Thailand | 14.0 /100 | #212 | Poor 5.5% |
| Immigrants | Liberia | 13.3 /100 | #213 | Poor 5.5% |
| Iroquois | 13.1 /100 | #214 | Poor 5.5% |