Subsaharan African vs Trinidadian and Tobagonian Doctorate Degree
COMPARE
Subsaharan African
Trinidadian and Tobagonian
Doctorate Degree
Doctorate Degree Comparison
Sub-Saharan Africans
Trinidadians and Tobagonians
1.8%
DOCTORATE DEGREE
25.1/ 100
METRIC RATING
196th/ 347
METRIC RANK
1.5%
DOCTORATE DEGREE
1.0/ 100
METRIC RATING
255th/ 347
METRIC RANK
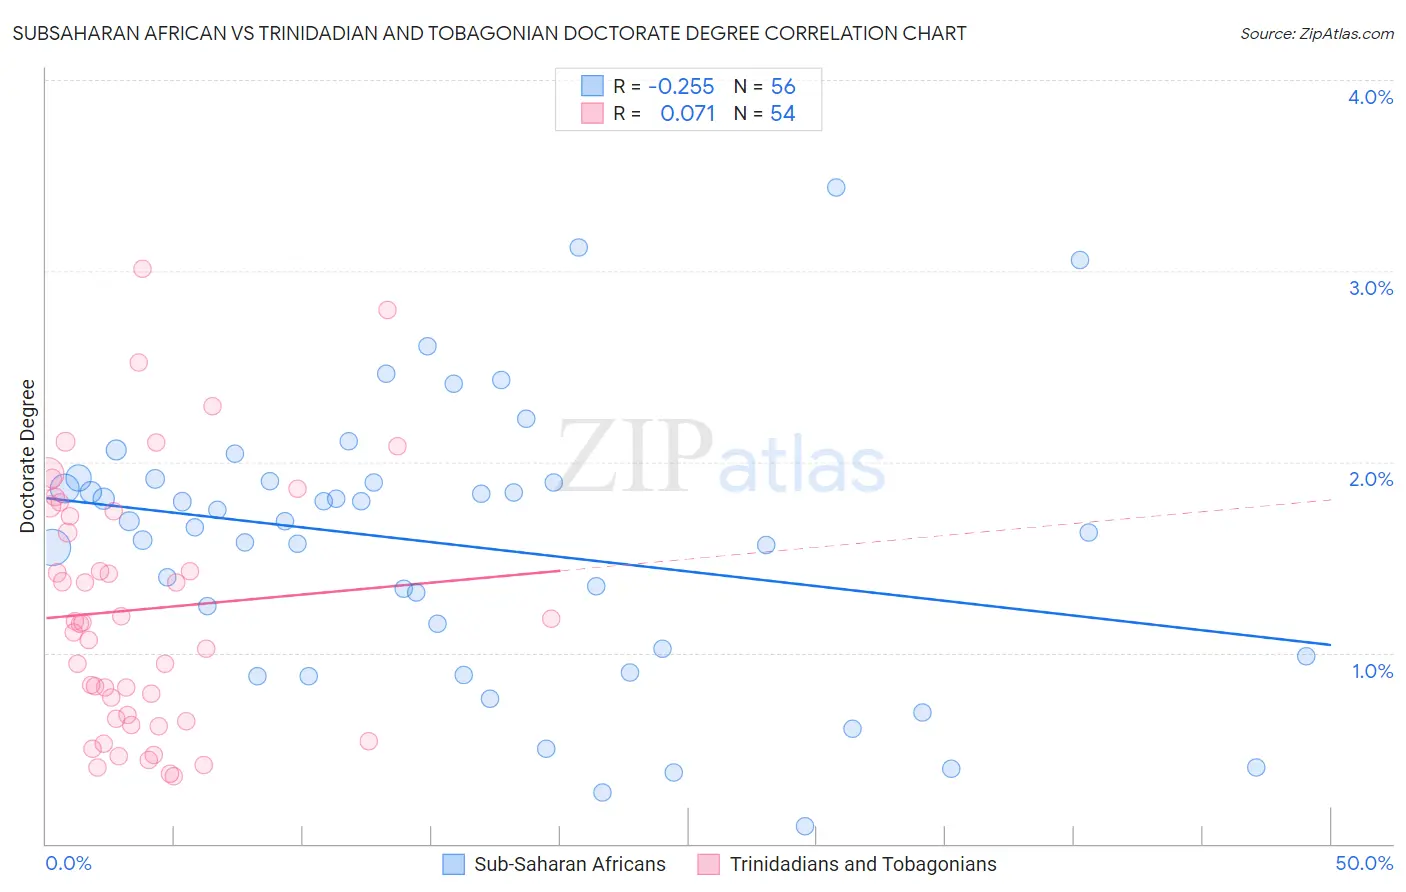
Subsaharan African vs Trinidadian and Tobagonian Doctorate Degree Correlation Chart
The statistical analysis conducted on geographies consisting of 497,272,855 people shows a weak negative correlation between the proportion of Sub-Saharan Africans and percentage of population with at least doctorate degree education in the United States with a correlation coefficient (R) of -0.255 and weighted average of 1.8%. Similarly, the statistical analysis conducted on geographies consisting of 218,914,311 people shows a slight positive correlation between the proportion of Trinidadians and Tobagonians and percentage of population with at least doctorate degree education in the United States with a correlation coefficient (R) of 0.071 and weighted average of 1.5%, a difference of 15.5%.
Doctorate Degree Correlation Summary
| Measurement | Subsaharan African | Trinidadian and Tobagonian |
| Minimum | 0.094% | 0.35% |
| Maximum | 3.4% | 3.0% |
| Range | 3.3% | 2.7% |
| Mean | 1.6% | 1.2% |
| Median | 1.7% | 1.2% |
| Interquartile 25% (IQ1) | 1.0% | 0.65% |
| Interquartile 75% (IQ3) | 1.9% | 1.7% |
| Interquartile Range (IQR) | 0.89% | 1.1% |
| Standard Deviation (Sample) | 0.72% | 0.66% |
| Standard Deviation (Population) | 0.71% | 0.65% |
Similar Demographics by Doctorate Degree
Demographics Similar to Sub-Saharan Africans by Doctorate Degree
In terms of doctorate degree, the demographic groups most similar to Sub-Saharan Africans are Chinese (1.8%, a difference of 0.0%), Immigrants from Somalia (1.8%, a difference of 0.070%), Immigrants from Ghana (1.8%, a difference of 0.090%), Uruguayan (1.8%, a difference of 0.22%), and Immigrants from South America (1.8%, a difference of 0.38%).
| Demographics | Rating | Rank | Doctorate Degree |
| French Canadians | 30.2 /100 | #189 | Fair 1.8% |
| Immigrants | Costa Rica | 30.2 /100 | #190 | Fair 1.8% |
| South Americans | 29.5 /100 | #191 | Fair 1.8% |
| Dutch | 27.4 /100 | #192 | Fair 1.8% |
| German Russians | 27.1 /100 | #193 | Fair 1.8% |
| Uruguayans | 26.2 /100 | #194 | Fair 1.8% |
| Immigrants | Somalia | 25.4 /100 | #195 | Fair 1.8% |
| Sub-Saharan Africans | 25.1 /100 | #196 | Fair 1.8% |
| Chinese | 25.1 /100 | #197 | Fair 1.8% |
| Immigrants | Ghana | 24.6 /100 | #198 | Fair 1.8% |
| Immigrants | South America | 23.3 /100 | #199 | Fair 1.8% |
| Whites/Caucasians | 22.8 /100 | #200 | Fair 1.8% |
| Immigrants | Nigeria | 22.4 /100 | #201 | Fair 1.8% |
| Portuguese | 21.4 /100 | #202 | Fair 1.8% |
| Immigrants | Vietnam | 21.4 /100 | #203 | Fair 1.8% |
Demographics Similar to Trinidadians and Tobagonians by Doctorate Degree
In terms of doctorate degree, the demographic groups most similar to Trinidadians and Tobagonians are Immigrants from Cambodia (1.5%, a difference of 0.010%), Central American Indian (1.5%, a difference of 0.050%), American (1.5%, a difference of 0.13%), Chippewa (1.5%, a difference of 0.27%), and Yuman (1.5%, a difference of 0.28%).
| Demographics | Rating | Rank | Doctorate Degree |
| Africans | 1.8 /100 | #248 | Tragic 1.6% |
| Potawatomi | 1.6 /100 | #249 | Tragic 1.6% |
| Immigrants | Fiji | 1.6 /100 | #250 | Tragic 1.6% |
| Apache | 1.3 /100 | #251 | Tragic 1.5% |
| Yuman | 1.1 /100 | #252 | Tragic 1.5% |
| Americans | 1.0 /100 | #253 | Tragic 1.5% |
| Immigrants | Cambodia | 1.0 /100 | #254 | Tragic 1.5% |
| Trinidadians and Tobagonians | 1.0 /100 | #255 | Tragic 1.5% |
| Central American Indians | 1.0 /100 | #256 | Tragic 1.5% |
| Chippewa | 0.9 /100 | #257 | Tragic 1.5% |
| Immigrants | West Indies | 0.9 /100 | #258 | Tragic 1.5% |
| Liberians | 0.9 /100 | #259 | Tragic 1.5% |
| Japanese | 0.9 /100 | #260 | Tragic 1.5% |
| Immigrants | Portugal | 0.8 /100 | #261 | Tragic 1.5% |
| Chickasaw | 0.7 /100 | #262 | Tragic 1.5% |