Hopi vs Trinidadian and Tobagonian Single Female Poverty
COMPARE
Hopi
Trinidadian and Tobagonian
Single Female Poverty
Single Female Poverty Comparison
Hopi
Trinidadians and Tobagonians
28.0%
SINGLE FEMALE POVERTY
0.0/ 100
METRIC RATING
330th/ 347
METRIC RANK
21.2%
SINGLE FEMALE POVERTY
35.2/ 100
METRIC RATING
190th/ 347
METRIC RANK
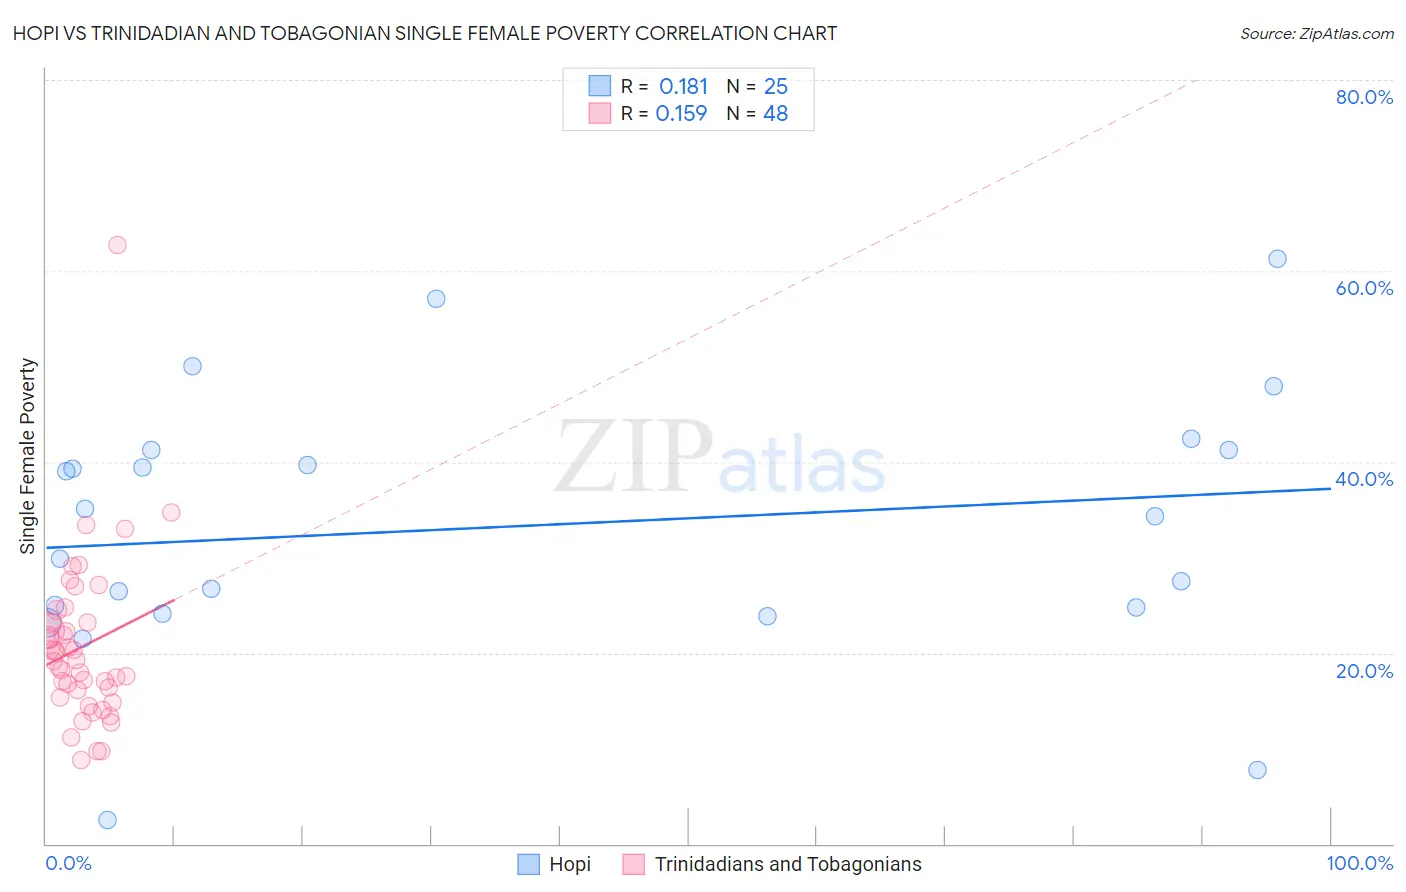
Hopi vs Trinidadian and Tobagonian Single Female Poverty Correlation Chart
The statistical analysis conducted on geographies consisting of 74,526,987 people shows a poor positive correlation between the proportion of Hopi and poverty level among single females in the United States with a correlation coefficient (R) of 0.181 and weighted average of 28.0%. Similarly, the statistical analysis conducted on geographies consisting of 217,955,182 people shows a poor positive correlation between the proportion of Trinidadians and Tobagonians and poverty level among single females in the United States with a correlation coefficient (R) of 0.159 and weighted average of 21.2%, a difference of 32.2%.
Single Female Poverty Correlation Summary
| Measurement | Hopi | Trinidadian and Tobagonian |
| Minimum | 2.4% | 8.8% |
| Maximum | 61.3% | 62.7% |
| Range | 58.9% | 53.9% |
| Mean | 33.2% | 20.6% |
| Median | 34.3% | 19.2% |
| Interquartile 25% (IQ1) | 24.4% | 15.7% |
| Interquartile 75% (IQ3) | 41.2% | 23.2% |
| Interquartile Range (IQR) | 16.8% | 7.5% |
| Standard Deviation (Sample) | 13.7% | 8.7% |
| Standard Deviation (Population) | 13.4% | 8.6% |
Similar Demographics by Single Female Poverty
Demographics Similar to Hopi by Single Female Poverty
In terms of single female poverty, the demographic groups most similar to Hopi are Native/Alaskan (28.2%, a difference of 0.64%), Menominee (27.8%, a difference of 0.71%), Yakama (28.3%, a difference of 0.90%), Apache (27.7%, a difference of 1.2%), and Ute (28.4%, a difference of 1.3%).
| Demographics | Rating | Rank | Single Female Poverty |
| Chippewa | 0.0 /100 | #323 | Tragic 26.8% |
| Kiowa | 0.0 /100 | #324 | Tragic 26.9% |
| Choctaw | 0.0 /100 | #325 | Tragic 27.2% |
| Creek | 0.0 /100 | #326 | Tragic 27.4% |
| Dutch West Indians | 0.0 /100 | #327 | Tragic 27.5% |
| Apache | 0.0 /100 | #328 | Tragic 27.7% |
| Menominee | 0.0 /100 | #329 | Tragic 27.8% |
| Hopi | 0.0 /100 | #330 | Tragic 28.0% |
| Natives/Alaskans | 0.0 /100 | #331 | Tragic 28.2% |
| Yakama | 0.0 /100 | #332 | Tragic 28.3% |
| Ute | 0.0 /100 | #333 | Tragic 28.4% |
| Pueblo | 0.0 /100 | #334 | Tragic 28.6% |
| Immigrants | Yemen | 0.0 /100 | #335 | Tragic 28.9% |
| Colville | 0.0 /100 | #336 | Tragic 29.1% |
| Yuman | 0.0 /100 | #337 | Tragic 29.4% |
Demographics Similar to Trinidadians and Tobagonians by Single Female Poverty
In terms of single female poverty, the demographic groups most similar to Trinidadians and Tobagonians are Immigrants from Cuba (21.2%, a difference of 0.0%), Yugoslavian (21.2%, a difference of 0.010%), Immigrants from Nigeria (21.2%, a difference of 0.10%), Hawaiian (21.2%, a difference of 0.16%), and Immigrants from Cambodia (21.2%, a difference of 0.20%).
| Demographics | Rating | Rank | Single Female Poverty |
| Slovaks | 39.7 /100 | #183 | Fair 21.1% |
| Hungarians | 39.6 /100 | #184 | Fair 21.1% |
| Immigrants | Cambodia | 38.2 /100 | #185 | Fair 21.2% |
| Hawaiians | 37.7 /100 | #186 | Fair 21.2% |
| Immigrants | Nigeria | 36.8 /100 | #187 | Fair 21.2% |
| Yugoslavians | 35.4 /100 | #188 | Fair 21.2% |
| Immigrants | Cuba | 35.3 /100 | #189 | Fair 21.2% |
| Trinidadians and Tobagonians | 35.2 /100 | #190 | Fair 21.2% |
| Immigrants | Germany | 31.1 /100 | #191 | Fair 21.3% |
| Immigrants | Jamaica | 30.5 /100 | #192 | Fair 21.3% |
| Basques | 28.1 /100 | #193 | Fair 21.3% |
| Czechoslovakians | 27.7 /100 | #194 | Fair 21.3% |
| Nicaraguans | 27.6 /100 | #195 | Fair 21.3% |
| Immigrants | Saudi Arabia | 27.1 /100 | #196 | Fair 21.3% |
| Japanese | 26.4 /100 | #197 | Fair 21.3% |