Subsaharan African vs Trinidadian and Tobagonian Professional Degree
COMPARE
Subsaharan African
Trinidadian and Tobagonian
Professional Degree
Professional Degree Comparison
Sub-Saharan Africans
Trinidadians and Tobagonians
4.1%
PROFESSIONAL DEGREE
12.8/ 100
METRIC RATING
207th/ 347
METRIC RANK
4.0%
PROFESSIONAL DEGREE
7.1/ 100
METRIC RATING
224th/ 347
METRIC RANK
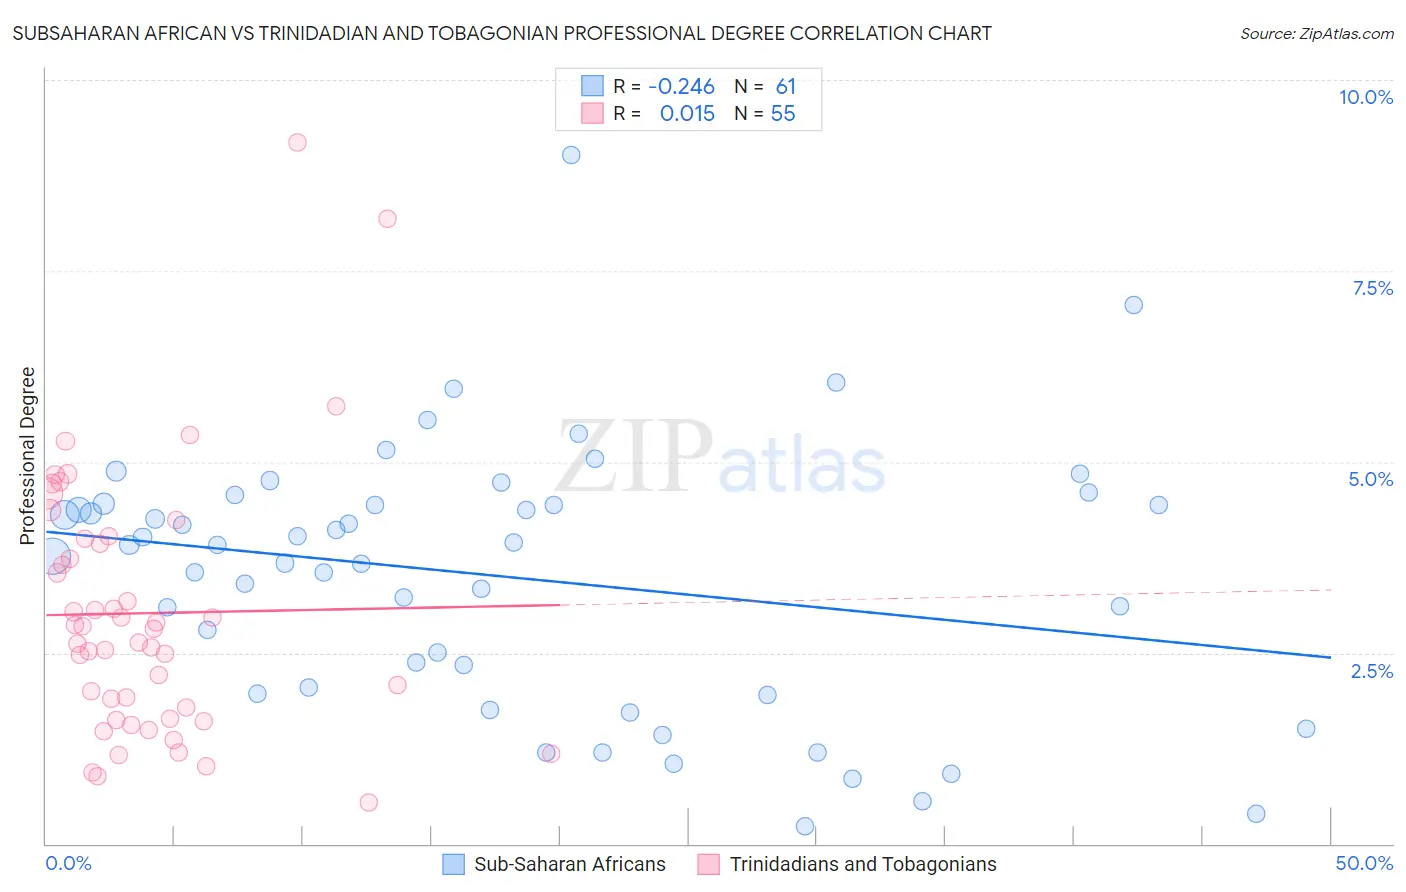
Subsaharan African vs Trinidadian and Tobagonian Professional Degree Correlation Chart
The statistical analysis conducted on geographies consisting of 505,148,465 people shows a weak negative correlation between the proportion of Sub-Saharan Africans and percentage of population with at least professional degree education in the United States with a correlation coefficient (R) of -0.246 and weighted average of 4.1%. Similarly, the statistical analysis conducted on geographies consisting of 219,572,491 people shows no correlation between the proportion of Trinidadians and Tobagonians and percentage of population with at least professional degree education in the United States with a correlation coefficient (R) of 0.015 and weighted average of 4.0%, a difference of 2.6%.
Professional Degree Correlation Summary
| Measurement | Subsaharan African | Trinidadian and Tobagonian |
| Minimum | 0.23% | 0.53% |
| Maximum | 9.0% | 9.2% |
| Range | 8.8% | 8.7% |
| Mean | 3.5% | 3.0% |
| Median | 3.9% | 2.8% |
| Interquartile 25% (IQ1) | 2.0% | 1.6% |
| Interquartile 75% (IQ3) | 4.4% | 4.0% |
| Interquartile Range (IQR) | 2.4% | 2.4% |
| Standard Deviation (Sample) | 1.7% | 1.7% |
| Standard Deviation (Population) | 1.7% | 1.7% |
Demographics Similar to Sub-Saharan Africans and Trinidadians and Tobagonians by Professional Degree
In terms of professional degree, the demographic groups most similar to Sub-Saharan Africans are Immigrants from Somalia (4.1%, a difference of 0.080%), Immigrants from Panama (4.1%, a difference of 0.16%), Yugoslavian (4.1%, a difference of 0.24%), Immigrants from Nigeria (4.1%, a difference of 0.38%), and German (4.1%, a difference of 0.42%). Similarly, the demographic groups most similar to Trinidadians and Tobagonians are Tlingit-Haida (4.0%, a difference of 0.13%), Immigrants from Bosnia and Herzegovina (4.0%, a difference of 0.14%), Immigrants from Western Africa (4.0%, a difference of 0.22%), French Canadian (4.0%, a difference of 0.47%), and Ute (4.0%, a difference of 0.60%).
| Demographics | Rating | Rank | Professional Degree |
| Somalis | 14.8 /100 | #205 | Poor 4.1% |
| Yugoslavians | 13.4 /100 | #206 | Poor 4.1% |
| Sub-Saharan Africans | 12.8 /100 | #207 | Poor 4.1% |
| Immigrants | Somalia | 12.5 /100 | #208 | Poor 4.1% |
| Immigrants | Panama | 12.3 /100 | #209 | Poor 4.1% |
| Immigrants | Nigeria | 11.7 /100 | #210 | Poor 4.1% |
| Germans | 11.6 /100 | #211 | Poor 4.1% |
| Whites/Caucasians | 11.2 /100 | #212 | Poor 4.1% |
| Koreans | 10.7 /100 | #213 | Poor 4.1% |
| Immigrants | Ghana | 10.6 /100 | #214 | Poor 4.1% |
| Portuguese | 10.5 /100 | #215 | Poor 4.1% |
| West Indians | 9.8 /100 | #216 | Tragic 4.1% |
| Immigrants | Vietnam | 9.4 /100 | #217 | Tragic 4.0% |
| Dutch | 9.0 /100 | #218 | Tragic 4.0% |
| Immigrants | South Eastern Asia | 8.9 /100 | #219 | Tragic 4.0% |
| Ute | 8.2 /100 | #220 | Tragic 4.0% |
| French Canadians | 8.0 /100 | #221 | Tragic 4.0% |
| Immigrants | Western Africa | 7.5 /100 | #222 | Tragic 4.0% |
| Immigrants | Bosnia and Herzegovina | 7.4 /100 | #223 | Tragic 4.0% |
| Trinidadians and Tobagonians | 7.1 /100 | #224 | Tragic 4.0% |
| Tlingit-Haida | 6.9 /100 | #225 | Tragic 4.0% |