Immigrants from Belarus vs Trinidadian and Tobagonian Single Female Poverty
COMPARE
Immigrants from Belarus
Trinidadian and Tobagonian
Single Female Poverty
Single Female Poverty Comparison
Immigrants from Belarus
Trinidadians and Tobagonians
19.3%
SINGLE FEMALE POVERTY
99.4/ 100
METRIC RATING
74th/ 347
METRIC RANK
21.2%
SINGLE FEMALE POVERTY
35.2/ 100
METRIC RATING
190th/ 347
METRIC RANK
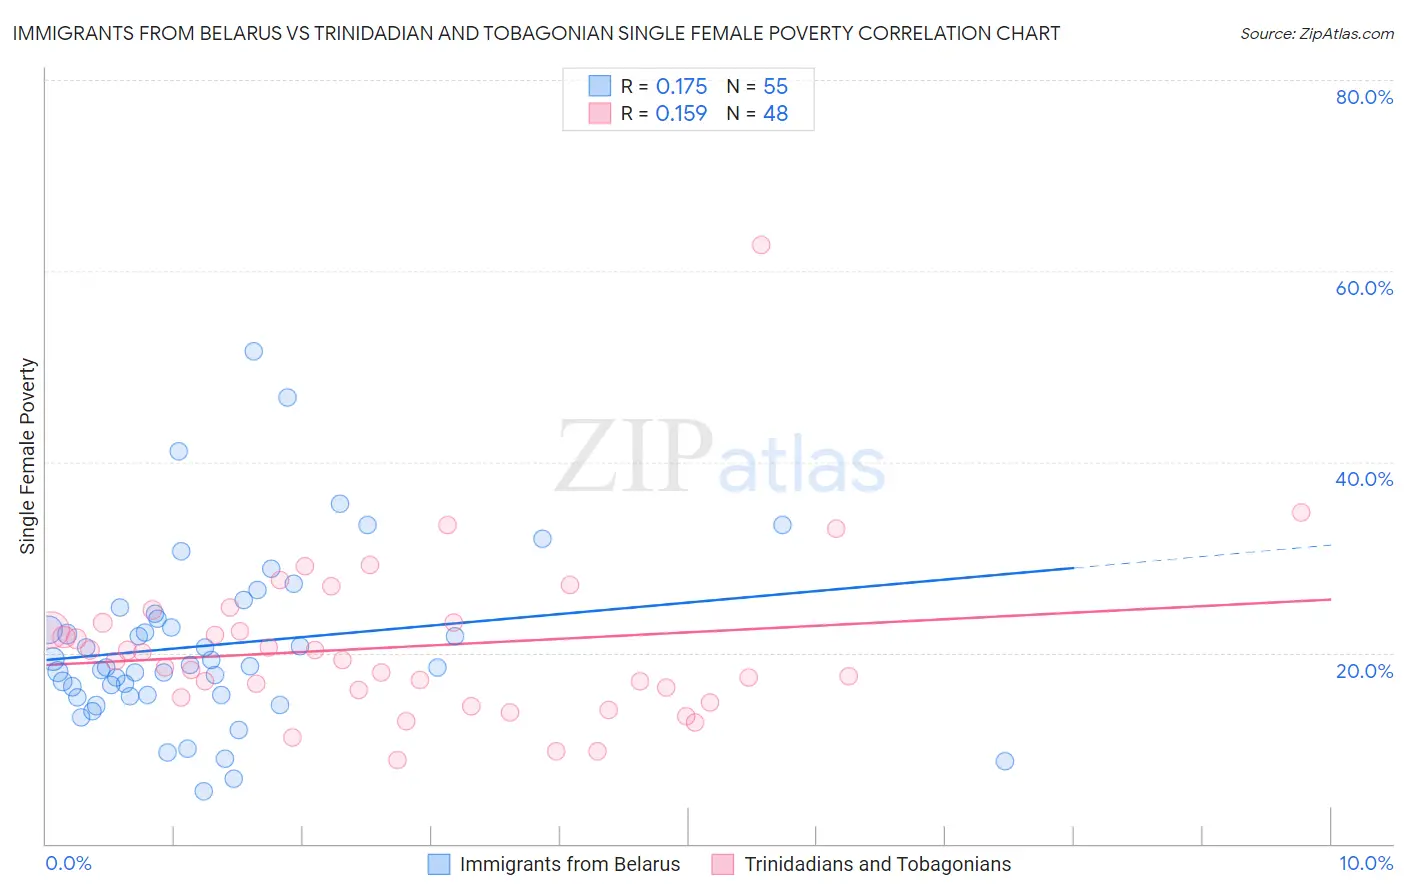
Immigrants from Belarus vs Trinidadian and Tobagonian Single Female Poverty Correlation Chart
The statistical analysis conducted on geographies consisting of 149,021,334 people shows a poor positive correlation between the proportion of Immigrants from Belarus and poverty level among single females in the United States with a correlation coefficient (R) of 0.175 and weighted average of 19.3%. Similarly, the statistical analysis conducted on geographies consisting of 217,955,182 people shows a poor positive correlation between the proportion of Trinidadians and Tobagonians and poverty level among single females in the United States with a correlation coefficient (R) of 0.159 and weighted average of 21.2%, a difference of 9.6%.
Single Female Poverty Correlation Summary
| Measurement | Immigrants from Belarus | Trinidadian and Tobagonian |
| Minimum | 5.6% | 8.8% |
| Maximum | 51.6% | 62.7% |
| Range | 46.1% | 53.9% |
| Mean | 20.8% | 20.6% |
| Median | 18.5% | 19.2% |
| Interquartile 25% (IQ1) | 15.5% | 15.7% |
| Interquartile 75% (IQ3) | 24.1% | 23.2% |
| Interquartile Range (IQR) | 8.6% | 7.5% |
| Standard Deviation (Sample) | 9.1% | 8.7% |
| Standard Deviation (Population) | 9.0% | 8.6% |
Similar Demographics by Single Female Poverty
Demographics Similar to Immigrants from Belarus by Single Female Poverty
In terms of single female poverty, the demographic groups most similar to Immigrants from Belarus are Immigrants from Peru (19.3%, a difference of 0.010%), Immigrants from Turkey (19.4%, a difference of 0.040%), Peruvian (19.4%, a difference of 0.070%), Immigrants from Latvia (19.3%, a difference of 0.11%), and Immigrants from South Eastern Asia (19.3%, a difference of 0.12%).
| Demographics | Rating | Rank | Single Female Poverty |
| Immigrants | Egypt | 99.6 /100 | #67 | Exceptional 19.2% |
| Laotians | 99.5 /100 | #68 | Exceptional 19.3% |
| Paraguayans | 99.5 /100 | #69 | Exceptional 19.3% |
| Immigrants | Jordan | 99.4 /100 | #70 | Exceptional 19.3% |
| Immigrants | South Eastern Asia | 99.4 /100 | #71 | Exceptional 19.3% |
| Immigrants | Latvia | 99.4 /100 | #72 | Exceptional 19.3% |
| Immigrants | Peru | 99.4 /100 | #73 | Exceptional 19.3% |
| Immigrants | Belarus | 99.4 /100 | #74 | Exceptional 19.3% |
| Immigrants | Turkey | 99.4 /100 | #75 | Exceptional 19.4% |
| Peruvians | 99.4 /100 | #76 | Exceptional 19.4% |
| Immigrants | Russia | 99.3 /100 | #77 | Exceptional 19.4% |
| Albanians | 99.3 /100 | #78 | Exceptional 19.4% |
| Immigrants | Sierra Leone | 99.3 /100 | #79 | Exceptional 19.4% |
| Immigrants | Australia | 99.3 /100 | #80 | Exceptional 19.4% |
| Immigrants | Scotland | 99.2 /100 | #81 | Exceptional 19.4% |
Demographics Similar to Trinidadians and Tobagonians by Single Female Poverty
In terms of single female poverty, the demographic groups most similar to Trinidadians and Tobagonians are Immigrants from Cuba (21.2%, a difference of 0.0%), Yugoslavian (21.2%, a difference of 0.010%), Immigrants from Nigeria (21.2%, a difference of 0.10%), Hawaiian (21.2%, a difference of 0.16%), and Immigrants from Cambodia (21.2%, a difference of 0.20%).
| Demographics | Rating | Rank | Single Female Poverty |
| Slovaks | 39.7 /100 | #183 | Fair 21.1% |
| Hungarians | 39.6 /100 | #184 | Fair 21.1% |
| Immigrants | Cambodia | 38.2 /100 | #185 | Fair 21.2% |
| Hawaiians | 37.7 /100 | #186 | Fair 21.2% |
| Immigrants | Nigeria | 36.8 /100 | #187 | Fair 21.2% |
| Yugoslavians | 35.4 /100 | #188 | Fair 21.2% |
| Immigrants | Cuba | 35.3 /100 | #189 | Fair 21.2% |
| Trinidadians and Tobagonians | 35.2 /100 | #190 | Fair 21.2% |
| Immigrants | Germany | 31.1 /100 | #191 | Fair 21.3% |
| Immigrants | Jamaica | 30.5 /100 | #192 | Fair 21.3% |
| Basques | 28.1 /100 | #193 | Fair 21.3% |
| Czechoslovakians | 27.7 /100 | #194 | Fair 21.3% |
| Nicaraguans | 27.6 /100 | #195 | Fair 21.3% |
| Immigrants | Saudi Arabia | 27.1 /100 | #196 | Fair 21.3% |
| Japanese | 26.4 /100 | #197 | Fair 21.3% |