Tongan vs Trinidadian and Tobagonian Single Female Poverty
COMPARE
Tongan
Trinidadian and Tobagonian
Single Female Poverty
Single Female Poverty Comparison
Tongans
Trinidadians and Tobagonians
18.8%
SINGLE FEMALE POVERTY
99.9/ 100
METRIC RATING
38th/ 347
METRIC RANK
21.2%
SINGLE FEMALE POVERTY
35.2/ 100
METRIC RATING
190th/ 347
METRIC RANK
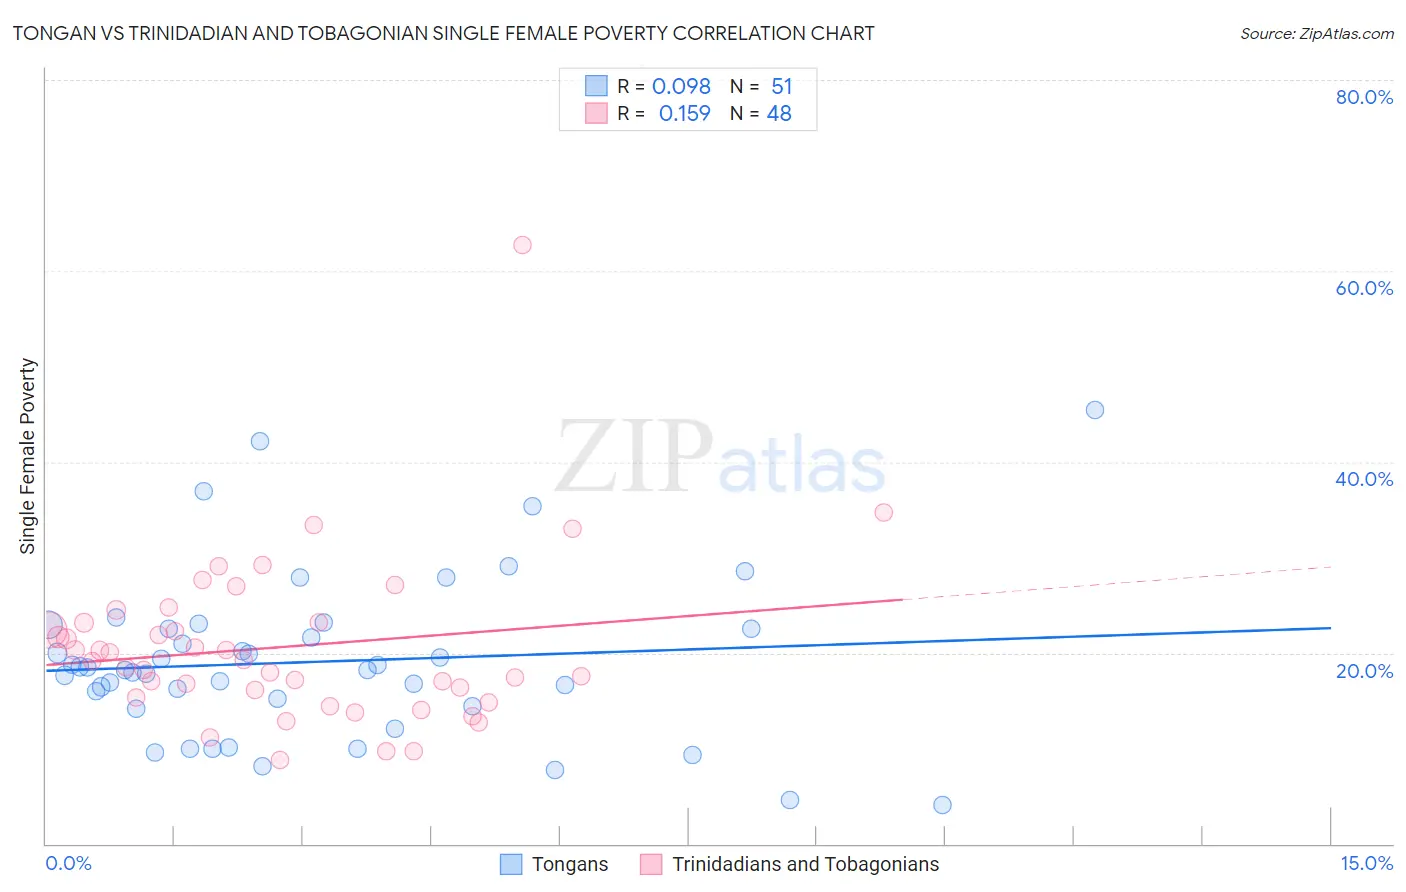
Tongan vs Trinidadian and Tobagonian Single Female Poverty Correlation Chart
The statistical analysis conducted on geographies consisting of 102,377,778 people shows a slight positive correlation between the proportion of Tongans and poverty level among single females in the United States with a correlation coefficient (R) of 0.098 and weighted average of 18.8%. Similarly, the statistical analysis conducted on geographies consisting of 217,955,182 people shows a poor positive correlation between the proportion of Trinidadians and Tobagonians and poverty level among single females in the United States with a correlation coefficient (R) of 0.159 and weighted average of 21.2%, a difference of 12.9%.
Single Female Poverty Correlation Summary
| Measurement | Tongan | Trinidadian and Tobagonian |
| Minimum | 4.0% | 8.8% |
| Maximum | 45.5% | 62.7% |
| Range | 41.5% | 53.9% |
| Mean | 19.1% | 20.6% |
| Median | 18.2% | 19.2% |
| Interquartile 25% (IQ1) | 14.3% | 15.7% |
| Interquartile 75% (IQ3) | 22.6% | 23.2% |
| Interquartile Range (IQR) | 8.2% | 7.5% |
| Standard Deviation (Sample) | 8.5% | 8.7% |
| Standard Deviation (Population) | 8.4% | 8.6% |
Similar Demographics by Single Female Poverty
Demographics Similar to Tongans by Single Female Poverty
In terms of single female poverty, the demographic groups most similar to Tongans are Bulgarian (18.8%, a difference of 0.030%), Okinawan (18.8%, a difference of 0.060%), Immigrants from Serbia (18.8%, a difference of 0.080%), Jordanian (18.8%, a difference of 0.16%), and Immigrants from Romania (18.8%, a difference of 0.31%).
| Demographics | Rating | Rank | Single Female Poverty |
| Immigrants | Asia | 99.9 /100 | #31 | Exceptional 18.6% |
| Immigrants | Sri Lanka | 99.9 /100 | #32 | Exceptional 18.6% |
| Immigrants | Philippines | 99.9 /100 | #33 | Exceptional 18.6% |
| Koreans | 99.9 /100 | #34 | Exceptional 18.6% |
| Immigrants | Japan | 99.9 /100 | #35 | Exceptional 18.6% |
| Turks | 99.9 /100 | #36 | Exceptional 18.7% |
| Immigrants | Armenia | 99.9 /100 | #37 | Exceptional 18.7% |
| Tongans | 99.9 /100 | #38 | Exceptional 18.8% |
| Bulgarians | 99.9 /100 | #39 | Exceptional 18.8% |
| Okinawans | 99.9 /100 | #40 | Exceptional 18.8% |
| Immigrants | Serbia | 99.9 /100 | #41 | Exceptional 18.8% |
| Jordanians | 99.9 /100 | #42 | Exceptional 18.8% |
| Immigrants | Romania | 99.9 /100 | #43 | Exceptional 18.8% |
| Immigrants | Croatia | 99.9 /100 | #44 | Exceptional 18.9% |
| Immigrants | Indonesia | 99.8 /100 | #45 | Exceptional 18.9% |
Demographics Similar to Trinidadians and Tobagonians by Single Female Poverty
In terms of single female poverty, the demographic groups most similar to Trinidadians and Tobagonians are Immigrants from Cuba (21.2%, a difference of 0.0%), Yugoslavian (21.2%, a difference of 0.010%), Immigrants from Nigeria (21.2%, a difference of 0.10%), Hawaiian (21.2%, a difference of 0.16%), and Immigrants from Cambodia (21.2%, a difference of 0.20%).
| Demographics | Rating | Rank | Single Female Poverty |
| Slovaks | 39.7 /100 | #183 | Fair 21.1% |
| Hungarians | 39.6 /100 | #184 | Fair 21.1% |
| Immigrants | Cambodia | 38.2 /100 | #185 | Fair 21.2% |
| Hawaiians | 37.7 /100 | #186 | Fair 21.2% |
| Immigrants | Nigeria | 36.8 /100 | #187 | Fair 21.2% |
| Yugoslavians | 35.4 /100 | #188 | Fair 21.2% |
| Immigrants | Cuba | 35.3 /100 | #189 | Fair 21.2% |
| Trinidadians and Tobagonians | 35.2 /100 | #190 | Fair 21.2% |
| Immigrants | Germany | 31.1 /100 | #191 | Fair 21.3% |
| Immigrants | Jamaica | 30.5 /100 | #192 | Fair 21.3% |
| Basques | 28.1 /100 | #193 | Fair 21.3% |
| Czechoslovakians | 27.7 /100 | #194 | Fair 21.3% |
| Nicaraguans | 27.6 /100 | #195 | Fair 21.3% |
| Immigrants | Saudi Arabia | 27.1 /100 | #196 | Fair 21.3% |
| Japanese | 26.4 /100 | #197 | Fair 21.3% |