Spanish American vs Immigrants from Eritrea Male Poverty
COMPARE
Spanish American
Immigrants from Eritrea
Male Poverty
Male Poverty Comparison
Spanish Americans
Immigrants from Eritrea
13.4%
MALE POVERTY
0.0/ 100
METRIC RATING
271st/ 347
METRIC RANK
12.2%
MALE POVERTY
2.4/ 100
METRIC RATING
220th/ 347
METRIC RANK
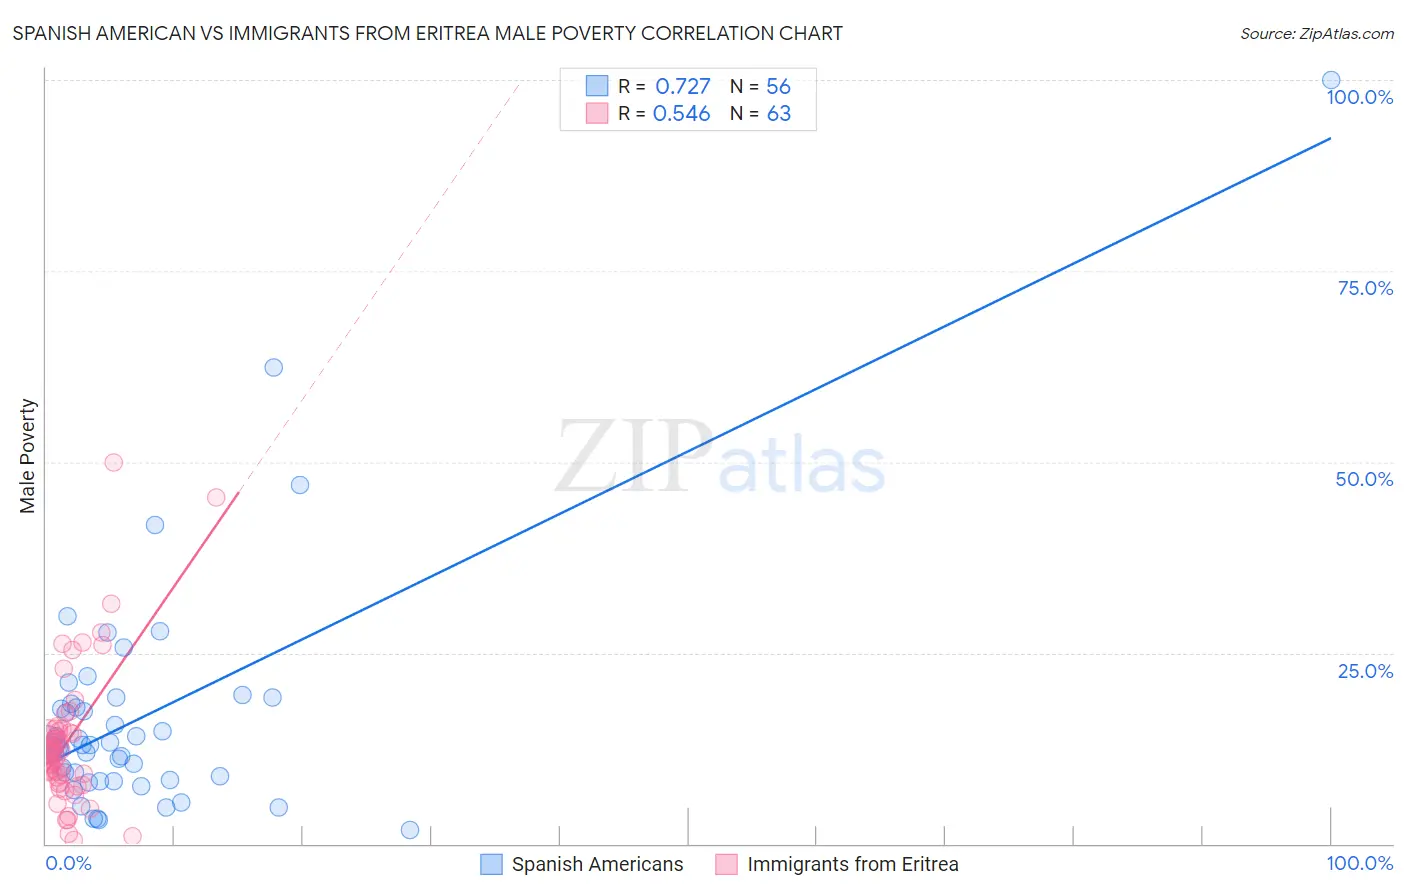
Spanish American vs Immigrants from Eritrea Male Poverty Correlation Chart
The statistical analysis conducted on geographies consisting of 103,163,136 people shows a strong positive correlation between the proportion of Spanish Americans and poverty level among males in the United States with a correlation coefficient (R) of 0.727 and weighted average of 13.4%. Similarly, the statistical analysis conducted on geographies consisting of 104,841,336 people shows a substantial positive correlation between the proportion of Immigrants from Eritrea and poverty level among males in the United States with a correlation coefficient (R) of 0.546 and weighted average of 12.2%, a difference of 9.4%.
Male Poverty Correlation Summary
| Measurement | Spanish American | Immigrants from Eritrea |
| Minimum | 1.7% | 0.53% |
| Maximum | 100.0% | 50.0% |
| Range | 98.3% | 49.5% |
| Mean | 16.5% | 13.4% |
| Median | 13.0% | 12.0% |
| Interquartile 25% (IQ1) | 8.6% | 8.6% |
| Interquartile 75% (IQ3) | 18.0% | 14.7% |
| Interquartile Range (IQR) | 9.4% | 6.1% |
| Standard Deviation (Sample) | 15.6% | 9.0% |
| Standard Deviation (Population) | 15.5% | 9.0% |
Similar Demographics by Male Poverty
Demographics Similar to Spanish Americans by Male Poverty
In terms of male poverty, the demographic groups most similar to Spanish Americans are Cree (13.3%, a difference of 0.030%), Guyanese (13.3%, a difference of 0.50%), Subsaharan African (13.3%, a difference of 0.72%), Immigrants from Jamaica (13.3%, a difference of 0.75%), and Immigrants from Bahamas (13.5%, a difference of 0.75%).
| Demographics | Rating | Rank | Male Poverty |
| Iroquois | 0.1 /100 | #264 | Tragic 13.2% |
| Jamaicans | 0.1 /100 | #265 | Tragic 13.2% |
| Immigrants | Guyana | 0.1 /100 | #266 | Tragic 13.2% |
| Immigrants | Jamaica | 0.1 /100 | #267 | Tragic 13.3% |
| Sub-Saharan Africans | 0.1 /100 | #268 | Tragic 13.3% |
| Guyanese | 0.0 /100 | #269 | Tragic 13.3% |
| Cree | 0.0 /100 | #270 | Tragic 13.3% |
| Spanish Americans | 0.0 /100 | #271 | Tragic 13.4% |
| Immigrants | Bahamas | 0.0 /100 | #272 | Tragic 13.5% |
| Chickasaw | 0.0 /100 | #273 | Tragic 13.5% |
| Immigrants | West Indies | 0.0 /100 | #274 | Tragic 13.5% |
| Barbadians | 0.0 /100 | #275 | Tragic 13.6% |
| Immigrants | Latin America | 0.0 /100 | #276 | Tragic 13.6% |
| Bangladeshis | 0.0 /100 | #277 | Tragic 13.6% |
| Belizeans | 0.0 /100 | #278 | Tragic 13.6% |
Demographics Similar to Immigrants from Eritrea by Male Poverty
In terms of male poverty, the demographic groups most similar to Immigrants from Eritrea are Bermudan (12.2%, a difference of 0.020%), German Russian (12.2%, a difference of 0.080%), Immigrants from Thailand (12.2%, a difference of 0.11%), Immigrants from Cambodia (12.2%, a difference of 0.12%), and Immigrants from Uzbekistan (12.2%, a difference of 0.20%).
| Demographics | Rating | Rank | Male Poverty |
| Immigrants | Nonimmigrants | 3.1 /100 | #213 | Tragic 12.1% |
| Japanese | 2.7 /100 | #214 | Tragic 12.2% |
| Immigrants | Uzbekistan | 2.6 /100 | #215 | Tragic 12.2% |
| Immigrants | Cambodia | 2.5 /100 | #216 | Tragic 12.2% |
| Immigrants | Thailand | 2.5 /100 | #217 | Tragic 12.2% |
| German Russians | 2.5 /100 | #218 | Tragic 12.2% |
| Bermudans | 2.4 /100 | #219 | Tragic 12.2% |
| Immigrants | Eritrea | 2.4 /100 | #220 | Tragic 12.2% |
| Ugandans | 2.2 /100 | #221 | Tragic 12.2% |
| Immigrants | Africa | 2.1 /100 | #222 | Tragic 12.2% |
| Immigrants | Micronesia | 2.1 /100 | #223 | Tragic 12.2% |
| Immigrants | Nigeria | 1.6 /100 | #224 | Tragic 12.3% |
| Osage | 1.5 /100 | #225 | Tragic 12.3% |
| Nigerians | 1.4 /100 | #226 | Tragic 12.3% |
| Alaska Natives | 1.4 /100 | #227 | Tragic 12.4% |