Spanish American vs Latvian Male Poverty
COMPARE
Spanish American
Latvian
Male Poverty
Male Poverty Comparison
Spanish Americans
Latvians
13.4%
MALE POVERTY
0.0/ 100
METRIC RATING
271st/ 347
METRIC RANK
9.6%
MALE POVERTY
99.7/ 100
METRIC RATING
20th/ 347
METRIC RANK
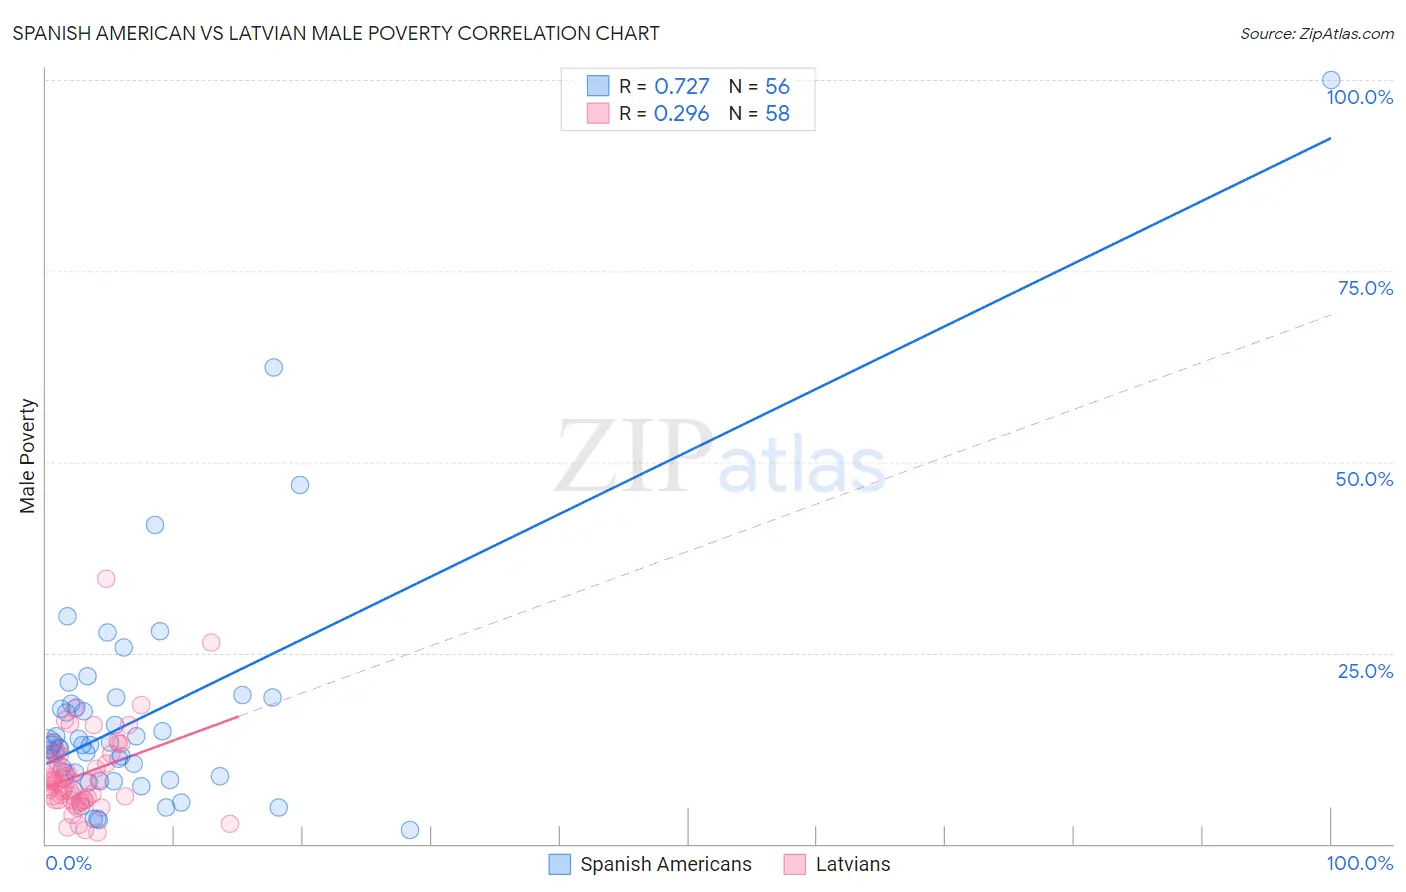
Spanish American vs Latvian Male Poverty Correlation Chart
The statistical analysis conducted on geographies consisting of 103,163,136 people shows a strong positive correlation between the proportion of Spanish Americans and poverty level among males in the United States with a correlation coefficient (R) of 0.727 and weighted average of 13.4%. Similarly, the statistical analysis conducted on geographies consisting of 220,591,162 people shows a weak positive correlation between the proportion of Latvians and poverty level among males in the United States with a correlation coefficient (R) of 0.296 and weighted average of 9.6%, a difference of 39.5%.
Male Poverty Correlation Summary
| Measurement | Spanish American | Latvian |
| Minimum | 1.7% | 1.5% |
| Maximum | 100.0% | 34.6% |
| Range | 98.3% | 33.2% |
| Mean | 16.5% | 9.2% |
| Median | 13.0% | 8.1% |
| Interquartile 25% (IQ1) | 8.6% | 5.8% |
| Interquartile 75% (IQ3) | 18.0% | 11.6% |
| Interquartile Range (IQR) | 9.4% | 5.8% |
| Standard Deviation (Sample) | 15.6% | 5.7% |
| Standard Deviation (Population) | 15.5% | 5.7% |
Similar Demographics by Male Poverty
Demographics Similar to Spanish Americans by Male Poverty
In terms of male poverty, the demographic groups most similar to Spanish Americans are Cree (13.3%, a difference of 0.030%), Guyanese (13.3%, a difference of 0.50%), Subsaharan African (13.3%, a difference of 0.72%), Immigrants from Jamaica (13.3%, a difference of 0.75%), and Immigrants from Bahamas (13.5%, a difference of 0.75%).
| Demographics | Rating | Rank | Male Poverty |
| Iroquois | 0.1 /100 | #264 | Tragic 13.2% |
| Jamaicans | 0.1 /100 | #265 | Tragic 13.2% |
| Immigrants | Guyana | 0.1 /100 | #266 | Tragic 13.2% |
| Immigrants | Jamaica | 0.1 /100 | #267 | Tragic 13.3% |
| Sub-Saharan Africans | 0.1 /100 | #268 | Tragic 13.3% |
| Guyanese | 0.0 /100 | #269 | Tragic 13.3% |
| Cree | 0.0 /100 | #270 | Tragic 13.3% |
| Spanish Americans | 0.0 /100 | #271 | Tragic 13.4% |
| Immigrants | Bahamas | 0.0 /100 | #272 | Tragic 13.5% |
| Chickasaw | 0.0 /100 | #273 | Tragic 13.5% |
| Immigrants | West Indies | 0.0 /100 | #274 | Tragic 13.5% |
| Barbadians | 0.0 /100 | #275 | Tragic 13.6% |
| Immigrants | Latin America | 0.0 /100 | #276 | Tragic 13.6% |
| Bangladeshis | 0.0 /100 | #277 | Tragic 13.6% |
| Belizeans | 0.0 /100 | #278 | Tragic 13.6% |
Demographics Similar to Latvians by Male Poverty
In terms of male poverty, the demographic groups most similar to Latvians are Immigrants from Hong Kong (9.6%, a difference of 0.10%), Immigrants from Scotland (9.6%, a difference of 0.26%), Lithuanian (9.5%, a difference of 0.28%), Norwegian (9.5%, a difference of 0.45%), and Croatian (9.6%, a difference of 0.51%).
| Demographics | Rating | Rank | Male Poverty |
| Immigrants | Lithuania | 99.9 /100 | #13 | Exceptional 9.4% |
| Immigrants | North Macedonia | 99.8 /100 | #14 | Exceptional 9.4% |
| Bhutanese | 99.8 /100 | #15 | Exceptional 9.5% |
| Luxembourgers | 99.8 /100 | #16 | Exceptional 9.5% |
| Norwegians | 99.8 /100 | #17 | Exceptional 9.5% |
| Lithuanians | 99.8 /100 | #18 | Exceptional 9.5% |
| Immigrants | Hong Kong | 99.7 /100 | #19 | Exceptional 9.6% |
| Latvians | 99.7 /100 | #20 | Exceptional 9.6% |
| Immigrants | Scotland | 99.7 /100 | #21 | Exceptional 9.6% |
| Croatians | 99.7 /100 | #22 | Exceptional 9.6% |
| Italians | 99.7 /100 | #23 | Exceptional 9.6% |
| Swedes | 99.7 /100 | #24 | Exceptional 9.6% |
| Eastern Europeans | 99.6 /100 | #25 | Exceptional 9.6% |
| Burmese | 99.6 /100 | #26 | Exceptional 9.7% |
| Danes | 99.6 /100 | #27 | Exceptional 9.7% |