Vietnamese vs Immigrants from Eritrea Male Poverty
COMPARE
Vietnamese
Immigrants from Eritrea
Male Poverty
Male Poverty Comparison
Vietnamese
Immigrants from Eritrea
13.8%
MALE POVERTY
0.0/ 100
METRIC RATING
291st/ 347
METRIC RANK
12.2%
MALE POVERTY
2.4/ 100
METRIC RATING
220th/ 347
METRIC RANK
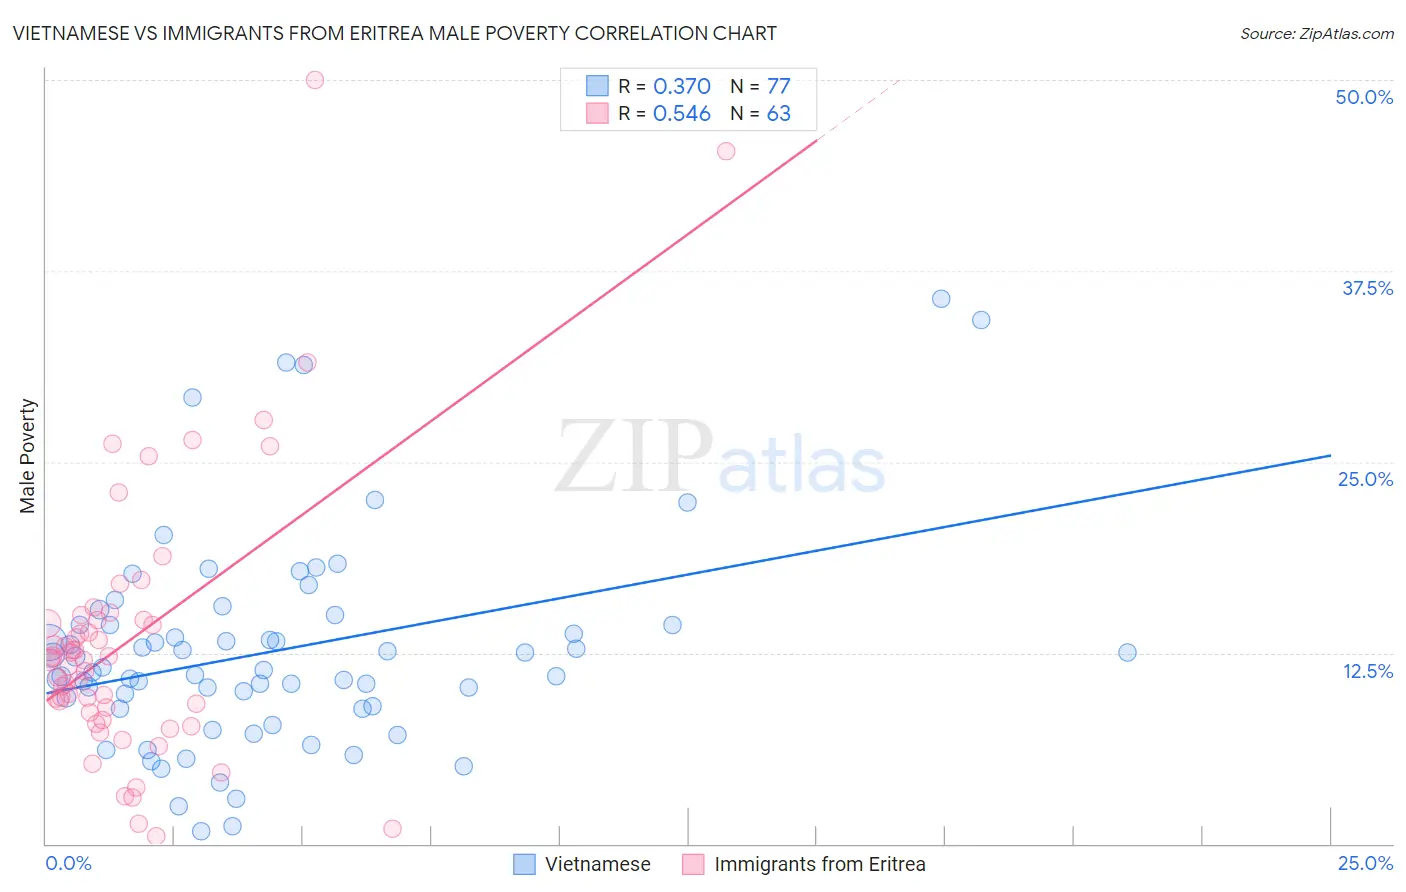
Vietnamese vs Immigrants from Eritrea Male Poverty Correlation Chart
The statistical analysis conducted on geographies consisting of 170,649,781 people shows a mild positive correlation between the proportion of Vietnamese and poverty level among males in the United States with a correlation coefficient (R) of 0.370 and weighted average of 13.8%. Similarly, the statistical analysis conducted on geographies consisting of 104,841,336 people shows a substantial positive correlation between the proportion of Immigrants from Eritrea and poverty level among males in the United States with a correlation coefficient (R) of 0.546 and weighted average of 12.2%, a difference of 13.2%.
Male Poverty Correlation Summary
| Measurement | Vietnamese | Immigrants from Eritrea |
| Minimum | 0.78% | 0.53% |
| Maximum | 35.7% | 50.0% |
| Range | 34.9% | 49.5% |
| Mean | 12.6% | 13.4% |
| Median | 11.4% | 12.0% |
| Interquartile 25% (IQ1) | 8.9% | 8.6% |
| Interquartile 75% (IQ3) | 14.3% | 14.7% |
| Interquartile Range (IQR) | 5.4% | 6.1% |
| Standard Deviation (Sample) | 6.9% | 9.0% |
| Standard Deviation (Population) | 6.8% | 9.0% |
Similar Demographics by Male Poverty
Demographics Similar to Vietnamese by Male Poverty
In terms of male poverty, the demographic groups most similar to Vietnamese are Immigrants from Zaire (13.8%, a difference of 0.090%), Guatemalan (13.8%, a difference of 0.10%), Indonesian (13.8%, a difference of 0.17%), Immigrants from Belize (13.8%, a difference of 0.18%), and Hispanic or Latino (13.9%, a difference of 0.24%).
| Demographics | Rating | Rank | Male Poverty |
| Immigrants | Haiti | 0.0 /100 | #284 | Tragic 13.8% |
| West Indians | 0.0 /100 | #285 | Tragic 13.8% |
| Shoshone | 0.0 /100 | #286 | Tragic 13.8% |
| Immigrants | Barbados | 0.0 /100 | #287 | Tragic 13.8% |
| Immigrants | St. Vincent and the Grenadines | 0.0 /100 | #288 | Tragic 13.8% |
| Guatemalans | 0.0 /100 | #289 | Tragic 13.8% |
| Immigrants | Zaire | 0.0 /100 | #290 | Tragic 13.8% |
| Vietnamese | 0.0 /100 | #291 | Tragic 13.8% |
| Indonesians | 0.0 /100 | #292 | Tragic 13.8% |
| Immigrants | Belize | 0.0 /100 | #293 | Tragic 13.8% |
| Hispanics or Latinos | 0.0 /100 | #294 | Tragic 13.9% |
| Immigrants | Central America | 0.0 /100 | #295 | Tragic 13.9% |
| Cajuns | 0.0 /100 | #296 | Tragic 13.9% |
| Inupiat | 0.0 /100 | #297 | Tragic 14.0% |
| Blackfeet | 0.0 /100 | #298 | Tragic 14.0% |
Demographics Similar to Immigrants from Eritrea by Male Poverty
In terms of male poverty, the demographic groups most similar to Immigrants from Eritrea are Bermudan (12.2%, a difference of 0.020%), German Russian (12.2%, a difference of 0.080%), Immigrants from Thailand (12.2%, a difference of 0.11%), Immigrants from Cambodia (12.2%, a difference of 0.12%), and Immigrants from Uzbekistan (12.2%, a difference of 0.20%).
| Demographics | Rating | Rank | Male Poverty |
| Immigrants | Nonimmigrants | 3.1 /100 | #213 | Tragic 12.1% |
| Japanese | 2.7 /100 | #214 | Tragic 12.2% |
| Immigrants | Uzbekistan | 2.6 /100 | #215 | Tragic 12.2% |
| Immigrants | Cambodia | 2.5 /100 | #216 | Tragic 12.2% |
| Immigrants | Thailand | 2.5 /100 | #217 | Tragic 12.2% |
| German Russians | 2.5 /100 | #218 | Tragic 12.2% |
| Bermudans | 2.4 /100 | #219 | Tragic 12.2% |
| Immigrants | Eritrea | 2.4 /100 | #220 | Tragic 12.2% |
| Ugandans | 2.2 /100 | #221 | Tragic 12.2% |
| Immigrants | Africa | 2.1 /100 | #222 | Tragic 12.2% |
| Immigrants | Micronesia | 2.1 /100 | #223 | Tragic 12.2% |
| Immigrants | Nigeria | 1.6 /100 | #224 | Tragic 12.3% |
| Osage | 1.5 /100 | #225 | Tragic 12.3% |
| Nigerians | 1.4 /100 | #226 | Tragic 12.3% |
| Alaska Natives | 1.4 /100 | #227 | Tragic 12.4% |