British vs Immigrants from Eritrea Male Poverty
COMPARE
British
Immigrants from Eritrea
Male Poverty
Male Poverty Comparison
British
Immigrants from Eritrea
10.4%
MALE POVERTY
94.8/ 100
METRIC RATING
91st/ 347
METRIC RANK
12.2%
MALE POVERTY
2.4/ 100
METRIC RATING
220th/ 347
METRIC RANK
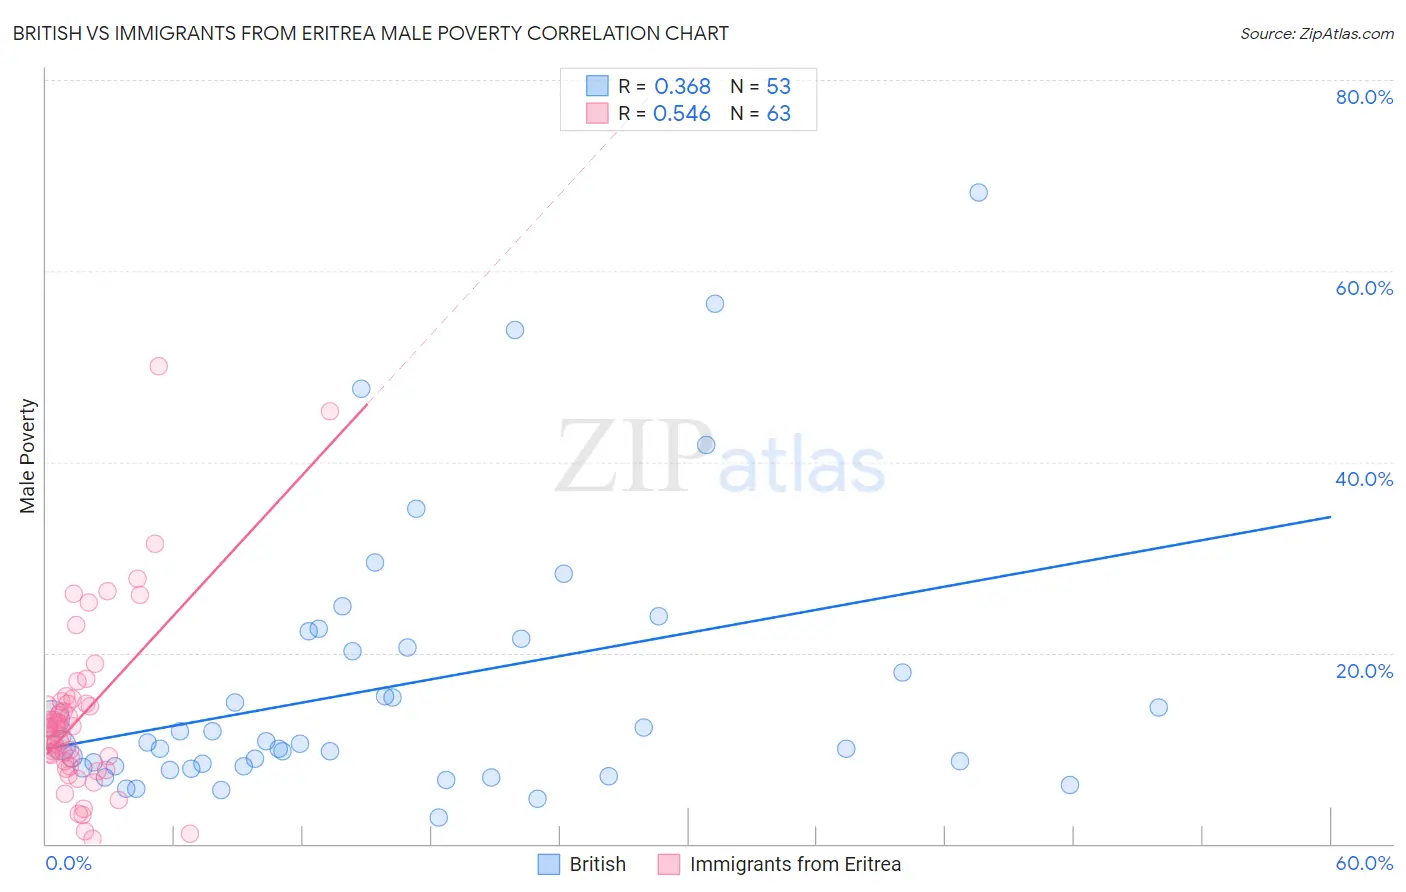
British vs Immigrants from Eritrea Male Poverty Correlation Chart
The statistical analysis conducted on geographies consisting of 530,450,397 people shows a mild positive correlation between the proportion of British and poverty level among males in the United States with a correlation coefficient (R) of 0.368 and weighted average of 10.4%. Similarly, the statistical analysis conducted on geographies consisting of 104,841,336 people shows a substantial positive correlation between the proportion of Immigrants from Eritrea and poverty level among males in the United States with a correlation coefficient (R) of 0.546 and weighted average of 12.2%, a difference of 17.5%.
Male Poverty Correlation Summary
| Measurement | British | Immigrants from Eritrea |
| Minimum | 2.8% | 0.53% |
| Maximum | 68.2% | 50.0% |
| Range | 65.4% | 49.5% |
| Mean | 16.5% | 13.4% |
| Median | 10.4% | 12.0% |
| Interquartile 25% (IQ1) | 8.0% | 8.6% |
| Interquartile 75% (IQ3) | 21.0% | 14.7% |
| Interquartile Range (IQR) | 13.0% | 6.1% |
| Standard Deviation (Sample) | 14.2% | 9.0% |
| Standard Deviation (Population) | 14.0% | 9.0% |
Similar Demographics by Male Poverty
Demographics Similar to British by Male Poverty
In terms of male poverty, the demographic groups most similar to British are Indian (Asian) (10.4%, a difference of 0.070%), Immigrants from Denmark (10.4%, a difference of 0.090%), Cambodian (10.4%, a difference of 0.10%), Jordanian (10.4%, a difference of 0.20%), and Australian (10.4%, a difference of 0.20%).
| Demographics | Rating | Rank | Male Poverty |
| Czechoslovakians | 95.6 /100 | #84 | Exceptional 10.3% |
| Immigrants | England | 95.5 /100 | #85 | Exceptional 10.4% |
| Immigrants | Eastern Asia | 95.3 /100 | #86 | Exceptional 10.4% |
| Northern Europeans | 95.2 /100 | #87 | Exceptional 10.4% |
| Cambodians | 95.0 /100 | #88 | Exceptional 10.4% |
| Immigrants | Denmark | 95.0 /100 | #89 | Exceptional 10.4% |
| Indians (Asian) | 94.9 /100 | #90 | Exceptional 10.4% |
| British | 94.8 /100 | #91 | Exceptional 10.4% |
| Jordanians | 94.4 /100 | #92 | Exceptional 10.4% |
| Australians | 94.4 /100 | #93 | Exceptional 10.4% |
| Immigrants | South Africa | 94.1 /100 | #94 | Exceptional 10.4% |
| Scottish | 94.0 /100 | #95 | Exceptional 10.4% |
| Immigrants | Egypt | 93.7 /100 | #96 | Exceptional 10.4% |
| Romanians | 93.6 /100 | #97 | Exceptional 10.5% |
| Finns | 93.4 /100 | #98 | Exceptional 10.5% |
Demographics Similar to Immigrants from Eritrea by Male Poverty
In terms of male poverty, the demographic groups most similar to Immigrants from Eritrea are Bermudan (12.2%, a difference of 0.020%), German Russian (12.2%, a difference of 0.080%), Immigrants from Thailand (12.2%, a difference of 0.11%), Immigrants from Cambodia (12.2%, a difference of 0.12%), and Immigrants from Uzbekistan (12.2%, a difference of 0.20%).
| Demographics | Rating | Rank | Male Poverty |
| Immigrants | Nonimmigrants | 3.1 /100 | #213 | Tragic 12.1% |
| Japanese | 2.7 /100 | #214 | Tragic 12.2% |
| Immigrants | Uzbekistan | 2.6 /100 | #215 | Tragic 12.2% |
| Immigrants | Cambodia | 2.5 /100 | #216 | Tragic 12.2% |
| Immigrants | Thailand | 2.5 /100 | #217 | Tragic 12.2% |
| German Russians | 2.5 /100 | #218 | Tragic 12.2% |
| Bermudans | 2.4 /100 | #219 | Tragic 12.2% |
| Immigrants | Eritrea | 2.4 /100 | #220 | Tragic 12.2% |
| Ugandans | 2.2 /100 | #221 | Tragic 12.2% |
| Immigrants | Africa | 2.1 /100 | #222 | Tragic 12.2% |
| Immigrants | Micronesia | 2.1 /100 | #223 | Tragic 12.2% |
| Immigrants | Nigeria | 1.6 /100 | #224 | Tragic 12.3% |
| Osage | 1.5 /100 | #225 | Tragic 12.3% |
| Nigerians | 1.4 /100 | #226 | Tragic 12.3% |
| Alaska Natives | 1.4 /100 | #227 | Tragic 12.4% |