Kiowa vs Immigrants from Eritrea Male Poverty
COMPARE
Kiowa
Immigrants from Eritrea
Male Poverty
Male Poverty Comparison
Kiowa
Immigrants from Eritrea
15.2%
MALE POVERTY
0.0/ 100
METRIC RATING
322nd/ 347
METRIC RANK
12.2%
MALE POVERTY
2.4/ 100
METRIC RATING
220th/ 347
METRIC RANK
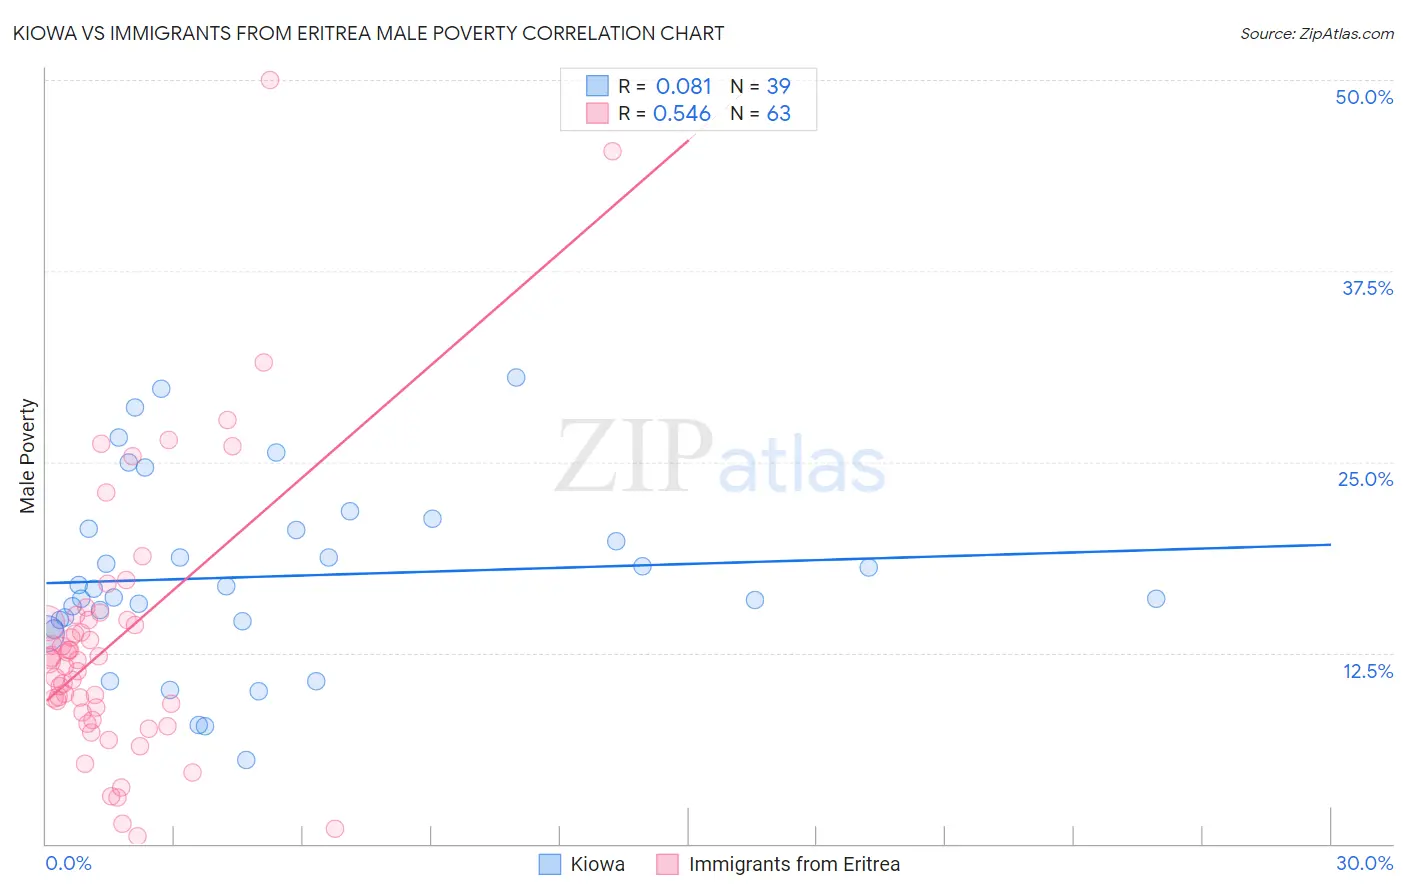
Kiowa vs Immigrants from Eritrea Male Poverty Correlation Chart
The statistical analysis conducted on geographies consisting of 56,098,824 people shows a slight positive correlation between the proportion of Kiowa and poverty level among males in the United States with a correlation coefficient (R) of 0.081 and weighted average of 15.2%. Similarly, the statistical analysis conducted on geographies consisting of 104,841,336 people shows a substantial positive correlation between the proportion of Immigrants from Eritrea and poverty level among males in the United States with a correlation coefficient (R) of 0.546 and weighted average of 12.2%, a difference of 24.4%.
Male Poverty Correlation Summary
| Measurement | Kiowa | Immigrants from Eritrea |
| Minimum | 5.5% | 0.53% |
| Maximum | 30.5% | 50.0% |
| Range | 25.0% | 49.5% |
| Mean | 17.5% | 13.4% |
| Median | 16.7% | 12.0% |
| Interquartile 25% (IQ1) | 14.6% | 8.6% |
| Interquartile 75% (IQ3) | 20.6% | 14.7% |
| Interquartile Range (IQR) | 6.0% | 6.1% |
| Standard Deviation (Sample) | 6.0% | 9.0% |
| Standard Deviation (Population) | 5.9% | 9.0% |
Similar Demographics by Male Poverty
Demographics Similar to Kiowa by Male Poverty
In terms of male poverty, the demographic groups most similar to Kiowa are Colville (15.2%, a difference of 0.39%), Menominee (15.3%, a difference of 0.58%), Arapaho (15.1%, a difference of 0.72%), Yakama (15.3%, a difference of 0.76%), and Central American Indian (15.3%, a difference of 0.87%).
| Demographics | Rating | Rank | Male Poverty |
| Chippewa | 0.0 /100 | #315 | Tragic 14.6% |
| British West Indians | 0.0 /100 | #316 | Tragic 14.6% |
| Immigrants | Dominica | 0.0 /100 | #317 | Tragic 14.7% |
| Immigrants | Grenada | 0.0 /100 | #318 | Tragic 14.7% |
| U.S. Virgin Islanders | 0.0 /100 | #319 | Tragic 14.7% |
| Immigrants | Congo | 0.0 /100 | #320 | Tragic 14.7% |
| Arapaho | 0.0 /100 | #321 | Tragic 15.1% |
| Kiowa | 0.0 /100 | #322 | Tragic 15.2% |
| Colville | 0.0 /100 | #323 | Tragic 15.2% |
| Menominee | 0.0 /100 | #324 | Tragic 15.3% |
| Yakama | 0.0 /100 | #325 | Tragic 15.3% |
| Central American Indians | 0.0 /100 | #326 | Tragic 15.3% |
| Paiute | 0.0 /100 | #327 | Tragic 15.8% |
| Blacks/African Americans | 0.0 /100 | #328 | Tragic 15.8% |
| Dominicans | 0.0 /100 | #329 | Tragic 16.1% |
Demographics Similar to Immigrants from Eritrea by Male Poverty
In terms of male poverty, the demographic groups most similar to Immigrants from Eritrea are Bermudan (12.2%, a difference of 0.020%), German Russian (12.2%, a difference of 0.080%), Immigrants from Thailand (12.2%, a difference of 0.11%), Immigrants from Cambodia (12.2%, a difference of 0.12%), and Immigrants from Uzbekistan (12.2%, a difference of 0.20%).
| Demographics | Rating | Rank | Male Poverty |
| Immigrants | Nonimmigrants | 3.1 /100 | #213 | Tragic 12.1% |
| Japanese | 2.7 /100 | #214 | Tragic 12.2% |
| Immigrants | Uzbekistan | 2.6 /100 | #215 | Tragic 12.2% |
| Immigrants | Cambodia | 2.5 /100 | #216 | Tragic 12.2% |
| Immigrants | Thailand | 2.5 /100 | #217 | Tragic 12.2% |
| German Russians | 2.5 /100 | #218 | Tragic 12.2% |
| Bermudans | 2.4 /100 | #219 | Tragic 12.2% |
| Immigrants | Eritrea | 2.4 /100 | #220 | Tragic 12.2% |
| Ugandans | 2.2 /100 | #221 | Tragic 12.2% |
| Immigrants | Africa | 2.1 /100 | #222 | Tragic 12.2% |
| Immigrants | Micronesia | 2.1 /100 | #223 | Tragic 12.2% |
| Immigrants | Nigeria | 1.6 /100 | #224 | Tragic 12.3% |
| Osage | 1.5 /100 | #225 | Tragic 12.3% |
| Nigerians | 1.4 /100 | #226 | Tragic 12.3% |
| Alaska Natives | 1.4 /100 | #227 | Tragic 12.4% |