Spanish American vs Creek Male Poverty
COMPARE
Spanish American
Creek
Male Poverty
Male Poverty Comparison
Spanish Americans
Creek
13.4%
MALE POVERTY
0.0/ 100
METRIC RATING
271st/ 347
METRIC RANK
14.1%
MALE POVERTY
0.0/ 100
METRIC RATING
306th/ 347
METRIC RANK
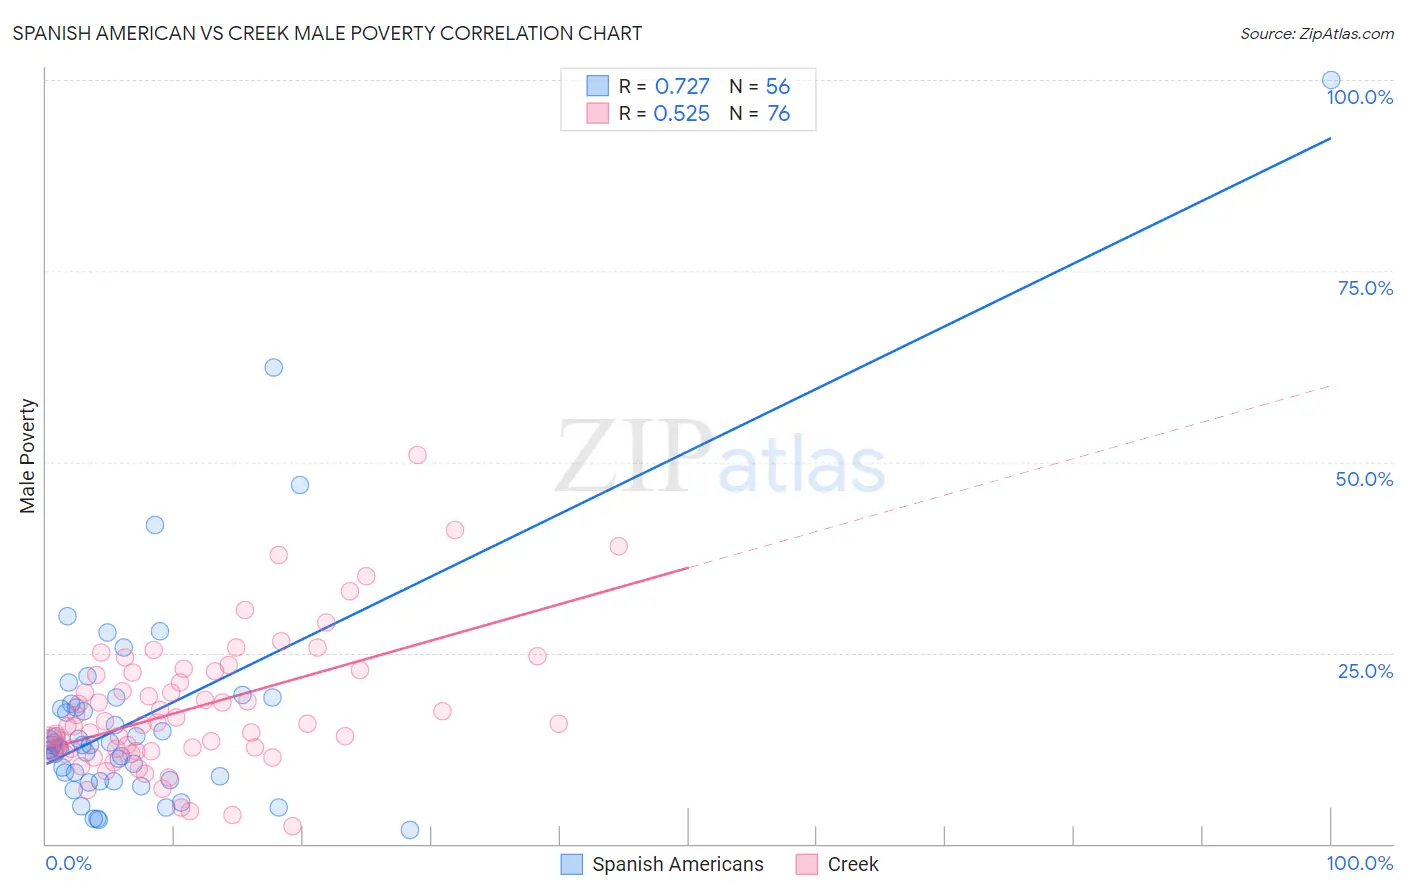
Spanish American vs Creek Male Poverty Correlation Chart
The statistical analysis conducted on geographies consisting of 103,163,136 people shows a strong positive correlation between the proportion of Spanish Americans and poverty level among males in the United States with a correlation coefficient (R) of 0.727 and weighted average of 13.4%. Similarly, the statistical analysis conducted on geographies consisting of 178,404,623 people shows a substantial positive correlation between the proportion of Creek and poverty level among males in the United States with a correlation coefficient (R) of 0.525 and weighted average of 14.1%, a difference of 5.7%.
Male Poverty Correlation Summary
| Measurement | Spanish American | Creek |
| Minimum | 1.7% | 2.3% |
| Maximum | 100.0% | 50.8% |
| Range | 98.3% | 48.5% |
| Mean | 16.5% | 17.8% |
| Median | 13.0% | 15.7% |
| Interquartile 25% (IQ1) | 8.6% | 12.3% |
| Interquartile 75% (IQ3) | 18.0% | 22.5% |
| Interquartile Range (IQR) | 9.4% | 10.2% |
| Standard Deviation (Sample) | 15.6% | 8.9% |
| Standard Deviation (Population) | 15.5% | 8.8% |
Similar Demographics by Male Poverty
Demographics Similar to Spanish Americans by Male Poverty
In terms of male poverty, the demographic groups most similar to Spanish Americans are Cree (13.3%, a difference of 0.030%), Guyanese (13.3%, a difference of 0.50%), Subsaharan African (13.3%, a difference of 0.72%), Immigrants from Jamaica (13.3%, a difference of 0.75%), and Immigrants from Bahamas (13.5%, a difference of 0.75%).
| Demographics | Rating | Rank | Male Poverty |
| Iroquois | 0.1 /100 | #264 | Tragic 13.2% |
| Jamaicans | 0.1 /100 | #265 | Tragic 13.2% |
| Immigrants | Guyana | 0.1 /100 | #266 | Tragic 13.2% |
| Immigrants | Jamaica | 0.1 /100 | #267 | Tragic 13.3% |
| Sub-Saharan Africans | 0.1 /100 | #268 | Tragic 13.3% |
| Guyanese | 0.0 /100 | #269 | Tragic 13.3% |
| Cree | 0.0 /100 | #270 | Tragic 13.3% |
| Spanish Americans | 0.0 /100 | #271 | Tragic 13.4% |
| Immigrants | Bahamas | 0.0 /100 | #272 | Tragic 13.5% |
| Chickasaw | 0.0 /100 | #273 | Tragic 13.5% |
| Immigrants | West Indies | 0.0 /100 | #274 | Tragic 13.5% |
| Barbadians | 0.0 /100 | #275 | Tragic 13.6% |
| Immigrants | Latin America | 0.0 /100 | #276 | Tragic 13.6% |
| Bangladeshis | 0.0 /100 | #277 | Tragic 13.6% |
| Belizeans | 0.0 /100 | #278 | Tragic 13.6% |
Demographics Similar to Creek by Male Poverty
In terms of male poverty, the demographic groups most similar to Creek are Immigrants from Bangladesh (14.1%, a difference of 0.070%), Senegalese (14.1%, a difference of 0.29%), Bahamian (14.1%, a difference of 0.39%), Immigrants from Caribbean (14.0%, a difference of 0.43%), and Immigrants from Senegal (14.0%, a difference of 0.49%).
| Demographics | Rating | Rank | Male Poverty |
| Immigrants | Guatemala | 0.0 /100 | #299 | Tragic 14.0% |
| Immigrants | Mexico | 0.0 /100 | #300 | Tragic 14.0% |
| Immigrants | Senegal | 0.0 /100 | #301 | Tragic 14.0% |
| Immigrants | Caribbean | 0.0 /100 | #302 | Tragic 14.0% |
| Bahamians | 0.0 /100 | #303 | Tragic 14.1% |
| Senegalese | 0.0 /100 | #304 | Tragic 14.1% |
| Immigrants | Bangladesh | 0.0 /100 | #305 | Tragic 14.1% |
| Creek | 0.0 /100 | #306 | Tragic 14.1% |
| Dutch West Indians | 0.0 /100 | #307 | Tragic 14.2% |
| Africans | 0.0 /100 | #308 | Tragic 14.2% |
| Somalis | 0.0 /100 | #309 | Tragic 14.3% |
| Seminole | 0.0 /100 | #310 | Tragic 14.3% |
| Hondurans | 0.0 /100 | #311 | Tragic 14.3% |
| Choctaw | 0.0 /100 | #312 | Tragic 14.4% |
| Immigrants | Somalia | 0.0 /100 | #313 | Tragic 14.6% |