Alaska Native vs Immigrants from Eritrea Male Poverty
COMPARE
Alaska Native
Immigrants from Eritrea
Male Poverty
Male Poverty Comparison
Alaska Natives
Immigrants from Eritrea
12.4%
MALE POVERTY
1.4/ 100
METRIC RATING
227th/ 347
METRIC RANK
12.2%
MALE POVERTY
2.4/ 100
METRIC RATING
220th/ 347
METRIC RANK
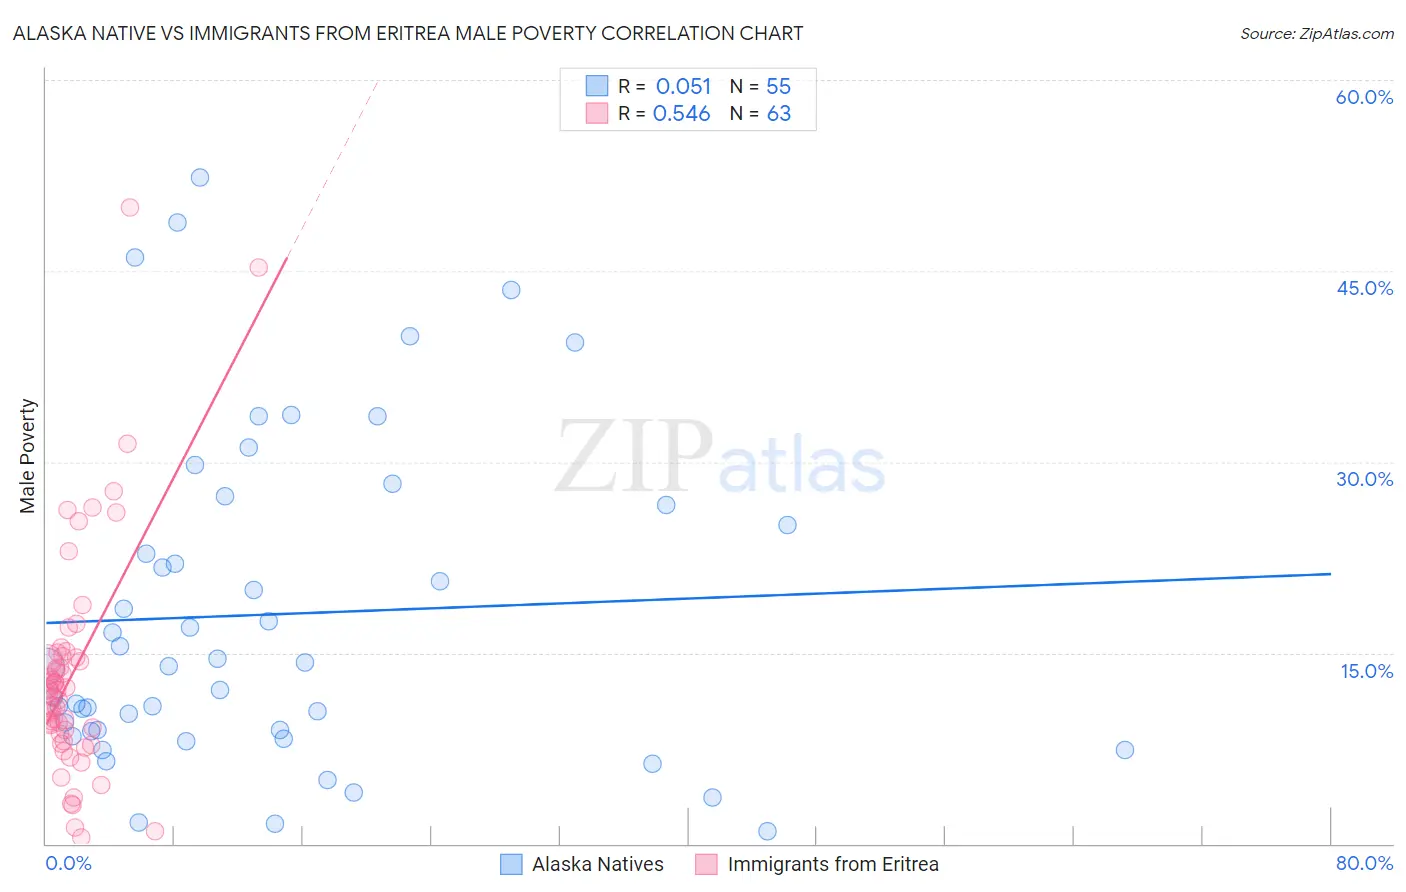
Alaska Native vs Immigrants from Eritrea Male Poverty Correlation Chart
The statistical analysis conducted on geographies consisting of 76,750,766 people shows a slight positive correlation between the proportion of Alaska Natives and poverty level among males in the United States with a correlation coefficient (R) of 0.051 and weighted average of 12.4%. Similarly, the statistical analysis conducted on geographies consisting of 104,841,336 people shows a substantial positive correlation between the proportion of Immigrants from Eritrea and poverty level among males in the United States with a correlation coefficient (R) of 0.546 and weighted average of 12.2%, a difference of 1.3%.
Male Poverty Correlation Summary
| Measurement | Alaska Native | Immigrants from Eritrea |
| Minimum | 0.96% | 0.53% |
| Maximum | 52.4% | 50.0% |
| Range | 51.4% | 49.5% |
| Mean | 18.0% | 13.4% |
| Median | 14.0% | 12.0% |
| Interquartile 25% (IQ1) | 8.8% | 8.6% |
| Interquartile 75% (IQ3) | 26.6% | 14.7% |
| Interquartile Range (IQR) | 17.8% | 6.1% |
| Standard Deviation (Sample) | 12.9% | 9.0% |
| Standard Deviation (Population) | 12.8% | 9.0% |
Demographics Similar to Alaska Natives and Immigrants from Eritrea by Male Poverty
In terms of male poverty, the demographic groups most similar to Alaska Natives are Alsatian (12.4%, a difference of 0.040%), Nigerian (12.3%, a difference of 0.090%), Cuban (12.4%, a difference of 0.13%), Osage (12.3%, a difference of 0.26%), and Immigrants from Nigeria (12.3%, a difference of 0.32%). Similarly, the demographic groups most similar to Immigrants from Eritrea are Bermudan (12.2%, a difference of 0.020%), German Russian (12.2%, a difference of 0.080%), Immigrants from Thailand (12.2%, a difference of 0.11%), Immigrants from Cambodia (12.2%, a difference of 0.12%), and Immigrants from Uzbekistan (12.2%, a difference of 0.20%).
| Demographics | Rating | Rank | Male Poverty |
| Immigrants | Nonimmigrants | 3.1 /100 | #213 | Tragic 12.1% |
| Japanese | 2.7 /100 | #214 | Tragic 12.2% |
| Immigrants | Uzbekistan | 2.6 /100 | #215 | Tragic 12.2% |
| Immigrants | Cambodia | 2.5 /100 | #216 | Tragic 12.2% |
| Immigrants | Thailand | 2.5 /100 | #217 | Tragic 12.2% |
| German Russians | 2.5 /100 | #218 | Tragic 12.2% |
| Bermudans | 2.4 /100 | #219 | Tragic 12.2% |
| Immigrants | Eritrea | 2.4 /100 | #220 | Tragic 12.2% |
| Ugandans | 2.2 /100 | #221 | Tragic 12.2% |
| Immigrants | Africa | 2.1 /100 | #222 | Tragic 12.2% |
| Immigrants | Micronesia | 2.1 /100 | #223 | Tragic 12.2% |
| Immigrants | Nigeria | 1.6 /100 | #224 | Tragic 12.3% |
| Osage | 1.5 /100 | #225 | Tragic 12.3% |
| Nigerians | 1.4 /100 | #226 | Tragic 12.3% |
| Alaska Natives | 1.4 /100 | #227 | Tragic 12.4% |
| Alsatians | 1.3 /100 | #228 | Tragic 12.4% |
| Cubans | 1.3 /100 | #229 | Tragic 12.4% |
| Marshallese | 0.8 /100 | #230 | Tragic 12.5% |
| Salvadorans | 0.6 /100 | #231 | Tragic 12.6% |
| Nicaraguans | 0.6 /100 | #232 | Tragic 12.6% |
| Fijians | 0.6 /100 | #233 | Tragic 12.6% |