Immigrants vs Immigrants from Eritrea Male Poverty
COMPARE
Immigrants
Immigrants from Eritrea
Male Poverty
Male Poverty Comparison
Immigrants
Immigrants from Eritrea
12.0%
MALE POVERTY
4.5/ 100
METRIC RATING
208th/ 347
METRIC RANK
12.2%
MALE POVERTY
2.4/ 100
METRIC RATING
220th/ 347
METRIC RANK
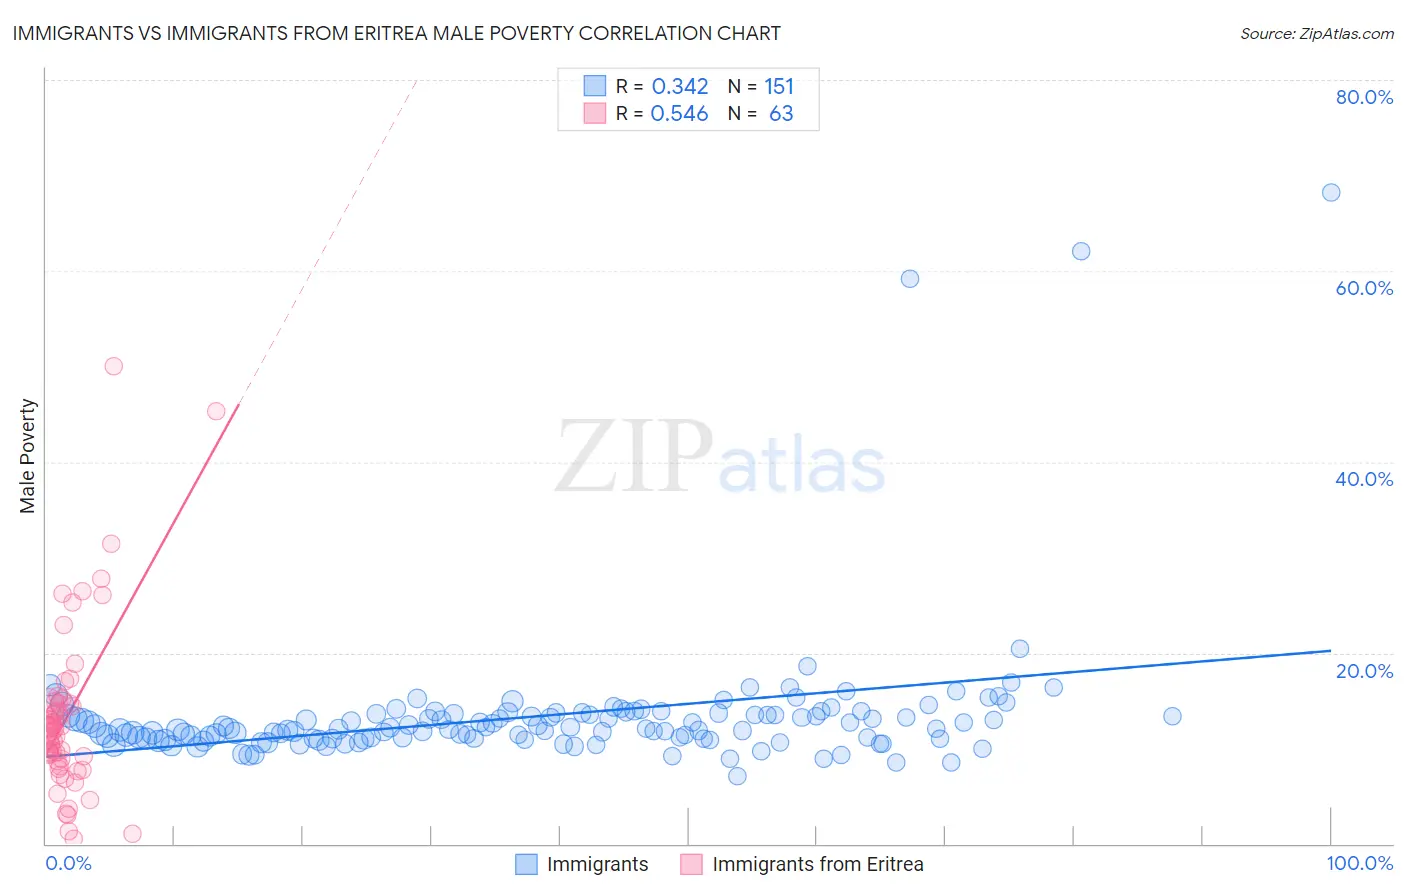
Immigrants vs Immigrants from Eritrea Male Poverty Correlation Chart
The statistical analysis conducted on geographies consisting of 575,955,105 people shows a mild positive correlation between the proportion of Immigrants and poverty level among males in the United States with a correlation coefficient (R) of 0.342 and weighted average of 12.0%. Similarly, the statistical analysis conducted on geographies consisting of 104,841,336 people shows a substantial positive correlation between the proportion of Immigrants from Eritrea and poverty level among males in the United States with a correlation coefficient (R) of 0.546 and weighted average of 12.2%, a difference of 1.5%.
Male Poverty Correlation Summary
| Measurement | Immigrants | Immigrants from Eritrea |
| Minimum | 7.0% | 0.53% |
| Maximum | 68.2% | 50.0% |
| Range | 61.1% | 49.5% |
| Mean | 13.4% | 13.4% |
| Median | 12.0% | 12.0% |
| Interquartile 25% (IQ1) | 11.0% | 8.6% |
| Interquartile 75% (IQ3) | 13.6% | 14.7% |
| Interquartile Range (IQR) | 2.6% | 6.1% |
| Standard Deviation (Sample) | 7.4% | 9.0% |
| Standard Deviation (Population) | 7.4% | 9.0% |
Demographics Similar to Immigrants and Immigrants from Eritrea by Male Poverty
In terms of male poverty, the demographic groups most similar to Immigrants are Immigrants from the Azores (12.0%, a difference of 0.12%), Moroccan (12.0%, a difference of 0.17%), Immigrants from Panama (12.1%, a difference of 0.29%), Malaysian (12.0%, a difference of 0.33%), and Immigrants from Eastern Africa (12.0%, a difference of 0.43%). Similarly, the demographic groups most similar to Immigrants from Eritrea are Bermudan (12.2%, a difference of 0.020%), German Russian (12.2%, a difference of 0.080%), Immigrants from Thailand (12.2%, a difference of 0.11%), Immigrants from Cambodia (12.2%, a difference of 0.12%), and Immigrants from Uzbekistan (12.2%, a difference of 0.20%).
| Demographics | Rating | Rank | Male Poverty |
| Immigrants | Uganda | 8.5 /100 | #204 | Tragic 11.8% |
| Panamanians | 6.2 /100 | #205 | Tragic 11.9% |
| Immigrants | Eastern Africa | 5.4 /100 | #206 | Tragic 12.0% |
| Malaysians | 5.2 /100 | #207 | Tragic 12.0% |
| Immigrants | Immigrants | 4.5 /100 | #208 | Tragic 12.0% |
| Immigrants | Azores | 4.3 /100 | #209 | Tragic 12.0% |
| Moroccans | 4.2 /100 | #210 | Tragic 12.0% |
| Immigrants | Panama | 4.0 /100 | #211 | Tragic 12.1% |
| Americans | 3.2 /100 | #212 | Tragic 12.1% |
| Immigrants | Nonimmigrants | 3.1 /100 | #213 | Tragic 12.1% |
| Japanese | 2.7 /100 | #214 | Tragic 12.2% |
| Immigrants | Uzbekistan | 2.6 /100 | #215 | Tragic 12.2% |
| Immigrants | Cambodia | 2.5 /100 | #216 | Tragic 12.2% |
| Immigrants | Thailand | 2.5 /100 | #217 | Tragic 12.2% |
| German Russians | 2.5 /100 | #218 | Tragic 12.2% |
| Bermudans | 2.4 /100 | #219 | Tragic 12.2% |
| Immigrants | Eritrea | 2.4 /100 | #220 | Tragic 12.2% |
| Ugandans | 2.2 /100 | #221 | Tragic 12.2% |
| Immigrants | Africa | 2.1 /100 | #222 | Tragic 12.2% |
| Immigrants | Micronesia | 2.1 /100 | #223 | Tragic 12.2% |
| Immigrants | Nigeria | 1.6 /100 | #224 | Tragic 12.3% |