Estonian vs Immigrants from Eritrea Male Poverty
COMPARE
Estonian
Immigrants from Eritrea
Male Poverty
Male Poverty Comparison
Estonians
Immigrants from Eritrea
10.1%
MALE POVERTY
98.1/ 100
METRIC RATING
57th/ 347
METRIC RANK
12.2%
MALE POVERTY
2.4/ 100
METRIC RATING
220th/ 347
METRIC RANK
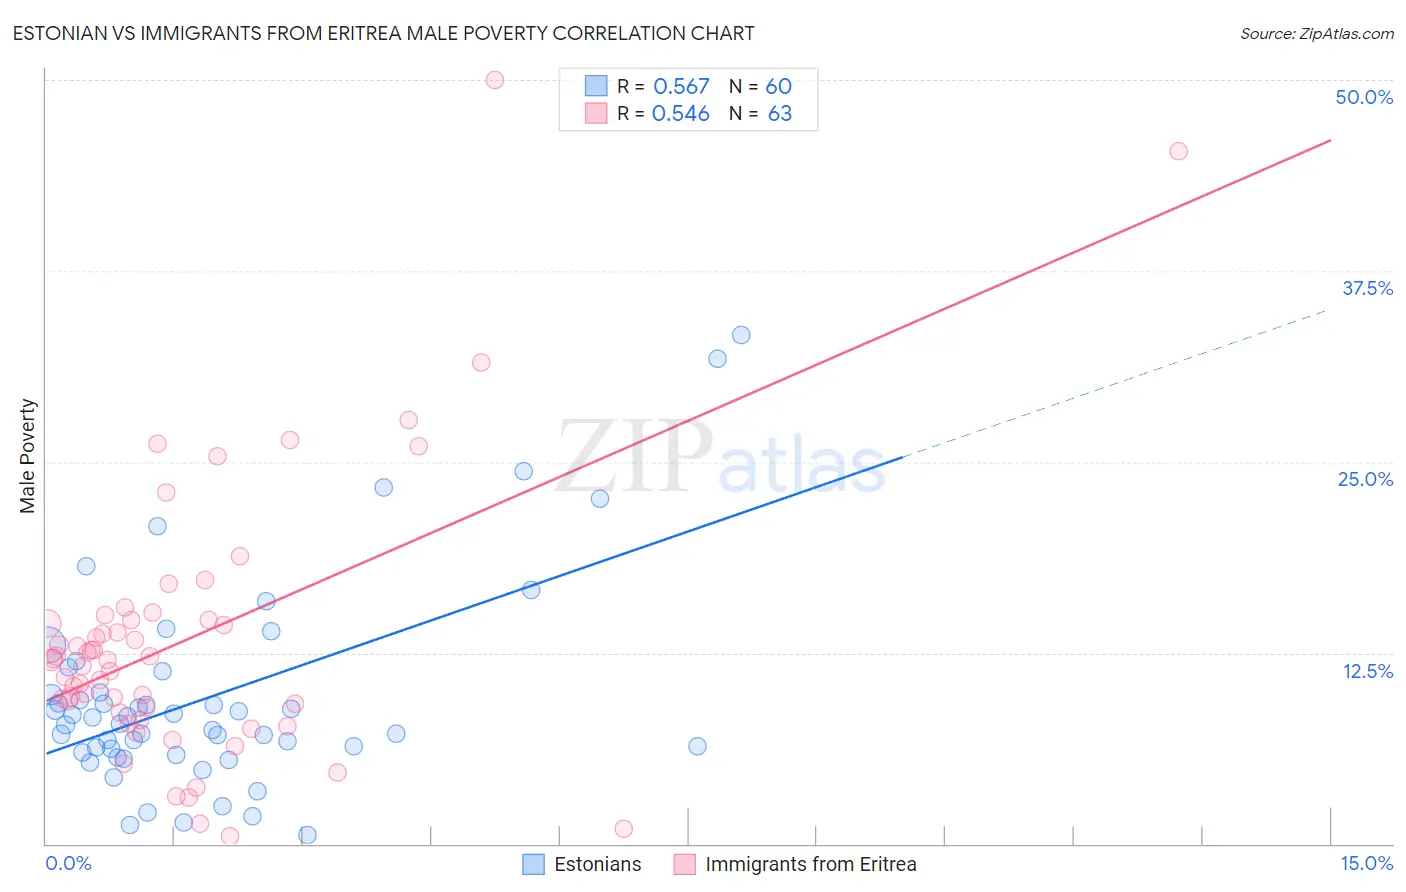
Estonian vs Immigrants from Eritrea Male Poverty Correlation Chart
The statistical analysis conducted on geographies consisting of 123,489,486 people shows a substantial positive correlation between the proportion of Estonians and poverty level among males in the United States with a correlation coefficient (R) of 0.567 and weighted average of 10.1%. Similarly, the statistical analysis conducted on geographies consisting of 104,841,336 people shows a substantial positive correlation between the proportion of Immigrants from Eritrea and poverty level among males in the United States with a correlation coefficient (R) of 0.546 and weighted average of 12.2%, a difference of 20.7%.
Male Poverty Correlation Summary
| Measurement | Estonian | Immigrants from Eritrea |
| Minimum | 0.61% | 0.53% |
| Maximum | 33.3% | 50.0% |
| Range | 32.7% | 49.5% |
| Mean | 9.6% | 13.4% |
| Median | 8.0% | 12.0% |
| Interquartile 25% (IQ1) | 6.1% | 8.6% |
| Interquartile 75% (IQ3) | 10.6% | 14.7% |
| Interquartile Range (IQR) | 4.5% | 6.1% |
| Standard Deviation (Sample) | 6.7% | 9.0% |
| Standard Deviation (Population) | 6.7% | 9.0% |
Similar Demographics by Male Poverty
Demographics Similar to Estonians by Male Poverty
In terms of male poverty, the demographic groups most similar to Estonians are Scandinavian (10.1%, a difference of 0.070%), Immigrants from Bulgaria (10.1%, a difference of 0.14%), Immigrants from Europe (10.1%, a difference of 0.21%), Ukrainian (10.1%, a difference of 0.30%), and Austrian (10.1%, a difference of 0.31%).
| Demographics | Rating | Rank | Male Poverty |
| Immigrants | Philippines | 98.7 /100 | #50 | Exceptional 10.0% |
| Immigrants | Croatia | 98.7 /100 | #51 | Exceptional 10.0% |
| Asians | 98.7 /100 | #52 | Exceptional 10.0% |
| Immigrants | Czechoslovakia | 98.6 /100 | #53 | Exceptional 10.0% |
| Immigrants | Austria | 98.5 /100 | #54 | Exceptional 10.0% |
| Germans | 98.3 /100 | #55 | Exceptional 10.1% |
| Immigrants | Bulgaria | 98.2 /100 | #56 | Exceptional 10.1% |
| Estonians | 98.1 /100 | #57 | Exceptional 10.1% |
| Scandinavians | 98.0 /100 | #58 | Exceptional 10.1% |
| Immigrants | Europe | 97.9 /100 | #59 | Exceptional 10.1% |
| Ukrainians | 97.9 /100 | #60 | Exceptional 10.1% |
| Austrians | 97.8 /100 | #61 | Exceptional 10.1% |
| Immigrants | Italy | 97.8 /100 | #62 | Exceptional 10.2% |
| Slovaks | 97.7 /100 | #63 | Exceptional 10.2% |
| Swiss | 97.5 /100 | #64 | Exceptional 10.2% |
Demographics Similar to Immigrants from Eritrea by Male Poverty
In terms of male poverty, the demographic groups most similar to Immigrants from Eritrea are Bermudan (12.2%, a difference of 0.020%), German Russian (12.2%, a difference of 0.080%), Immigrants from Thailand (12.2%, a difference of 0.11%), Immigrants from Cambodia (12.2%, a difference of 0.12%), and Immigrants from Uzbekistan (12.2%, a difference of 0.20%).
| Demographics | Rating | Rank | Male Poverty |
| Immigrants | Nonimmigrants | 3.1 /100 | #213 | Tragic 12.1% |
| Japanese | 2.7 /100 | #214 | Tragic 12.2% |
| Immigrants | Uzbekistan | 2.6 /100 | #215 | Tragic 12.2% |
| Immigrants | Cambodia | 2.5 /100 | #216 | Tragic 12.2% |
| Immigrants | Thailand | 2.5 /100 | #217 | Tragic 12.2% |
| German Russians | 2.5 /100 | #218 | Tragic 12.2% |
| Bermudans | 2.4 /100 | #219 | Tragic 12.2% |
| Immigrants | Eritrea | 2.4 /100 | #220 | Tragic 12.2% |
| Ugandans | 2.2 /100 | #221 | Tragic 12.2% |
| Immigrants | Africa | 2.1 /100 | #222 | Tragic 12.2% |
| Immigrants | Micronesia | 2.1 /100 | #223 | Tragic 12.2% |
| Immigrants | Nigeria | 1.6 /100 | #224 | Tragic 12.3% |
| Osage | 1.5 /100 | #225 | Tragic 12.3% |
| Nigerians | 1.4 /100 | #226 | Tragic 12.3% |
| Alaska Natives | 1.4 /100 | #227 | Tragic 12.4% |