Black/African American vs Immigrants from Eritrea Male Poverty
COMPARE
Black/African American
Immigrants from Eritrea
Male Poverty
Male Poverty Comparison
Blacks/African Americans
Immigrants from Eritrea
15.8%
MALE POVERTY
0.0/ 100
METRIC RATING
328th/ 347
METRIC RANK
12.2%
MALE POVERTY
2.4/ 100
METRIC RATING
220th/ 347
METRIC RANK
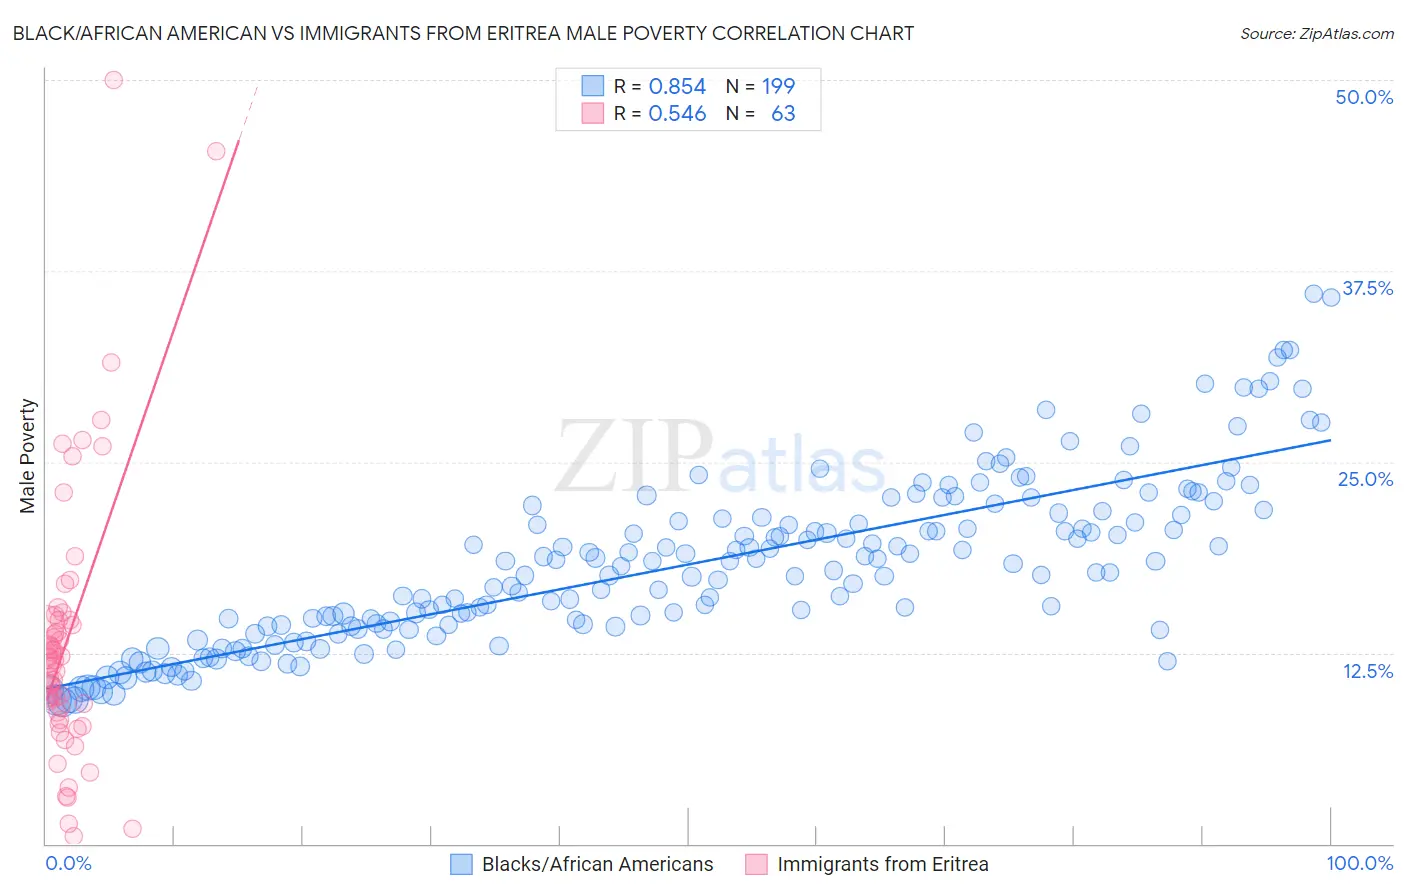
Black/African American vs Immigrants from Eritrea Male Poverty Correlation Chart
The statistical analysis conducted on geographies consisting of 564,646,557 people shows a very strong positive correlation between the proportion of Blacks/African Americans and poverty level among males in the United States with a correlation coefficient (R) of 0.854 and weighted average of 15.8%. Similarly, the statistical analysis conducted on geographies consisting of 104,841,336 people shows a substantial positive correlation between the proportion of Immigrants from Eritrea and poverty level among males in the United States with a correlation coefficient (R) of 0.546 and weighted average of 12.2%, a difference of 29.5%.
Male Poverty Correlation Summary
| Measurement | Black/African American | Immigrants from Eritrea |
| Minimum | 9.3% | 0.53% |
| Maximum | 36.0% | 50.0% |
| Range | 26.8% | 49.5% |
| Mean | 18.2% | 13.4% |
| Median | 17.9% | 12.0% |
| Interquartile 25% (IQ1) | 14.2% | 8.6% |
| Interquartile 75% (IQ3) | 21.3% | 14.7% |
| Interquartile Range (IQR) | 7.1% | 6.1% |
| Standard Deviation (Sample) | 5.5% | 9.0% |
| Standard Deviation (Population) | 5.5% | 9.0% |
Similar Demographics by Male Poverty
Demographics Similar to Blacks/African Americans by Male Poverty
In terms of male poverty, the demographic groups most similar to Blacks/African Americans are Paiute (15.8%, a difference of 0.060%), Dominican (16.1%, a difference of 1.7%), Immigrants from Dominican Republic (16.2%, a difference of 2.4%), Ute (16.2%, a difference of 2.7%), and Central American Indian (15.3%, a difference of 3.2%).
| Demographics | Rating | Rank | Male Poverty |
| Arapaho | 0.0 /100 | #321 | Tragic 15.1% |
| Kiowa | 0.0 /100 | #322 | Tragic 15.2% |
| Colville | 0.0 /100 | #323 | Tragic 15.2% |
| Menominee | 0.0 /100 | #324 | Tragic 15.3% |
| Yakama | 0.0 /100 | #325 | Tragic 15.3% |
| Central American Indians | 0.0 /100 | #326 | Tragic 15.3% |
| Paiute | 0.0 /100 | #327 | Tragic 15.8% |
| Blacks/African Americans | 0.0 /100 | #328 | Tragic 15.8% |
| Dominicans | 0.0 /100 | #329 | Tragic 16.1% |
| Immigrants | Dominican Republic | 0.0 /100 | #330 | Tragic 16.2% |
| Ute | 0.0 /100 | #331 | Tragic 16.2% |
| Houma | 0.0 /100 | #332 | Tragic 16.7% |
| Natives/Alaskans | 0.0 /100 | #333 | Tragic 16.9% |
| Cheyenne | 0.0 /100 | #334 | Tragic 17.6% |
| Apache | 0.0 /100 | #335 | Tragic 17.7% |
Demographics Similar to Immigrants from Eritrea by Male Poverty
In terms of male poverty, the demographic groups most similar to Immigrants from Eritrea are Bermudan (12.2%, a difference of 0.020%), German Russian (12.2%, a difference of 0.080%), Immigrants from Thailand (12.2%, a difference of 0.11%), Immigrants from Cambodia (12.2%, a difference of 0.12%), and Immigrants from Uzbekistan (12.2%, a difference of 0.20%).
| Demographics | Rating | Rank | Male Poverty |
| Immigrants | Nonimmigrants | 3.1 /100 | #213 | Tragic 12.1% |
| Japanese | 2.7 /100 | #214 | Tragic 12.2% |
| Immigrants | Uzbekistan | 2.6 /100 | #215 | Tragic 12.2% |
| Immigrants | Cambodia | 2.5 /100 | #216 | Tragic 12.2% |
| Immigrants | Thailand | 2.5 /100 | #217 | Tragic 12.2% |
| German Russians | 2.5 /100 | #218 | Tragic 12.2% |
| Bermudans | 2.4 /100 | #219 | Tragic 12.2% |
| Immigrants | Eritrea | 2.4 /100 | #220 | Tragic 12.2% |
| Ugandans | 2.2 /100 | #221 | Tragic 12.2% |
| Immigrants | Africa | 2.1 /100 | #222 | Tragic 12.2% |
| Immigrants | Micronesia | 2.1 /100 | #223 | Tragic 12.2% |
| Immigrants | Nigeria | 1.6 /100 | #224 | Tragic 12.3% |
| Osage | 1.5 /100 | #225 | Tragic 12.3% |
| Nigerians | 1.4 /100 | #226 | Tragic 12.3% |
| Alaska Natives | 1.4 /100 | #227 | Tragic 12.4% |