Spaniard vs Barbadian Female Poverty
COMPARE
Spaniard
Barbadian
Female Poverty
Female Poverty Comparison
Spaniards
Barbadians
13.9%
FEMALE POVERTY
18.9/ 100
METRIC RATING
204th/ 347
METRIC RANK
15.9%
FEMALE POVERTY
0.0/ 100
METRIC RATING
274th/ 347
METRIC RANK
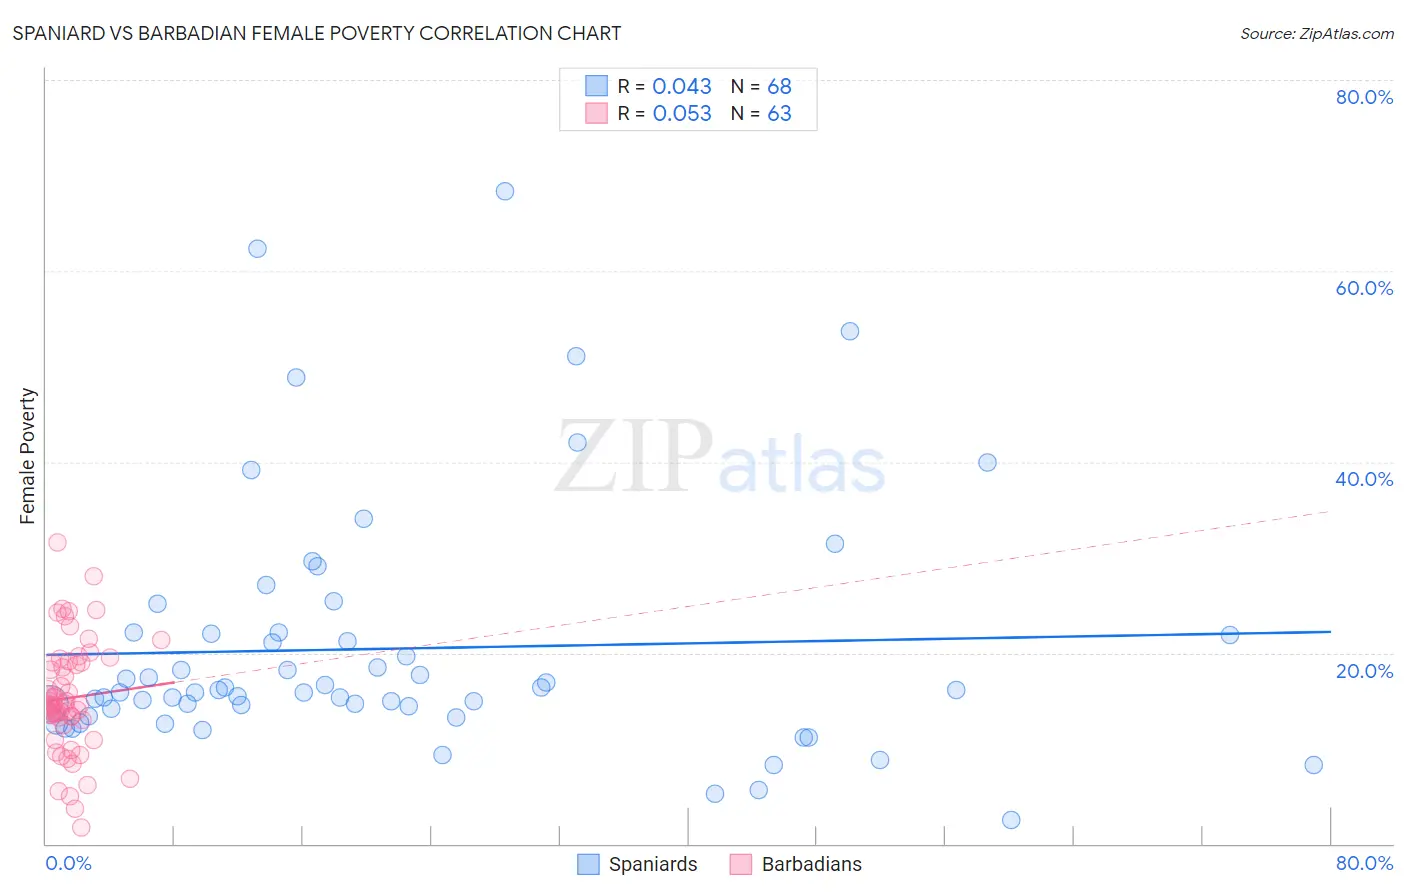
Spaniard vs Barbadian Female Poverty Correlation Chart
The statistical analysis conducted on geographies consisting of 443,063,734 people shows no correlation between the proportion of Spaniards and poverty level among females in the United States with a correlation coefficient (R) of 0.043 and weighted average of 13.9%. Similarly, the statistical analysis conducted on geographies consisting of 141,263,328 people shows a slight positive correlation between the proportion of Barbadians and poverty level among females in the United States with a correlation coefficient (R) of 0.053 and weighted average of 15.9%, a difference of 14.6%.
Female Poverty Correlation Summary
| Measurement | Spaniard | Barbadian |
| Minimum | 2.5% | 1.7% |
| Maximum | 68.3% | 31.5% |
| Range | 65.9% | 29.8% |
| Mean | 20.4% | 15.3% |
| Median | 15.9% | 14.6% |
| Interquartile 25% (IQ1) | 13.8% | 13.0% |
| Interquartile 75% (IQ3) | 22.0% | 18.9% |
| Interquartile Range (IQR) | 8.3% | 5.9% |
| Standard Deviation (Sample) | 13.0% | 5.8% |
| Standard Deviation (Population) | 12.9% | 5.8% |
Similar Demographics by Female Poverty
Demographics Similar to Spaniards by Female Poverty
In terms of female poverty, the demographic groups most similar to Spaniards are Immigrants from Western Asia (13.9%, a difference of 0.27%), Hmong (13.9%, a difference of 0.32%), Immigrants from Kenya (13.9%, a difference of 0.33%), Spanish (13.9%, a difference of 0.37%), and Ugandan (14.0%, a difference of 0.56%).
| Demographics | Rating | Rank | Female Poverty |
| Arabs | 28.6 /100 | #197 | Fair 13.7% |
| Immigrants | Uganda | 28.5 /100 | #198 | Fair 13.7% |
| Immigrants | Lebanon | 25.6 /100 | #199 | Fair 13.8% |
| Spanish | 21.4 /100 | #200 | Fair 13.9% |
| Immigrants | Kenya | 21.1 /100 | #201 | Fair 13.9% |
| Hmong | 21.1 /100 | #202 | Fair 13.9% |
| Immigrants | Western Asia | 20.7 /100 | #203 | Fair 13.9% |
| Spaniards | 18.9 /100 | #204 | Poor 13.9% |
| Ugandans | 15.4 /100 | #205 | Poor 14.0% |
| Immigrants | Uruguay | 14.0 /100 | #206 | Poor 14.0% |
| Immigrants | Eastern Africa | 9.0 /100 | #207 | Tragic 14.2% |
| Immigrants | Azores | 7.9 /100 | #208 | Tragic 14.2% |
| Panamanians | 7.7 /100 | #209 | Tragic 14.2% |
| Malaysians | 7.4 /100 | #210 | Tragic 14.3% |
| Moroccans | 7.2 /100 | #211 | Tragic 14.3% |
Demographics Similar to Barbadians by Female Poverty
In terms of female poverty, the demographic groups most similar to Barbadians are Haitian (15.9%, a difference of 0.0%), Belizean (15.9%, a difference of 0.010%), Immigrants from Barbados (16.0%, a difference of 0.070%), Central American (16.0%, a difference of 0.19%), and Immigrants from St. Vincent and the Grenadines (15.9%, a difference of 0.24%).
| Demographics | Rating | Rank | Female Poverty |
| Sub-Saharan Africans | 0.1 /100 | #267 | Tragic 15.8% |
| Immigrants | Nicaragua | 0.1 /100 | #268 | Tragic 15.8% |
| Iroquois | 0.1 /100 | #269 | Tragic 15.8% |
| Chickasaw | 0.1 /100 | #270 | Tragic 15.9% |
| Immigrants | St. Vincent and the Grenadines | 0.0 /100 | #271 | Tragic 15.9% |
| Belizeans | 0.0 /100 | #272 | Tragic 15.9% |
| Haitians | 0.0 /100 | #273 | Tragic 15.9% |
| Barbadians | 0.0 /100 | #274 | Tragic 15.9% |
| Immigrants | Barbados | 0.0 /100 | #275 | Tragic 16.0% |
| Central Americans | 0.0 /100 | #276 | Tragic 16.0% |
| Bangladeshis | 0.0 /100 | #277 | Tragic 16.0% |
| Immigrants | West Indies | 0.0 /100 | #278 | Tragic 16.1% |
| Immigrants | Bahamas | 0.0 /100 | #279 | Tragic 16.1% |
| Vietnamese | 0.0 /100 | #280 | Tragic 16.1% |
| West Indians | 0.0 /100 | #281 | Tragic 16.1% |