Spaniard vs Cypriot Female Poverty
COMPARE
Spaniard
Cypriot
Female Poverty
Female Poverty Comparison
Spaniards
Cypriots
13.9%
FEMALE POVERTY
18.9/ 100
METRIC RATING
204th/ 347
METRIC RANK
11.8%
FEMALE POVERTY
99.5/ 100
METRIC RATING
33rd/ 347
METRIC RANK
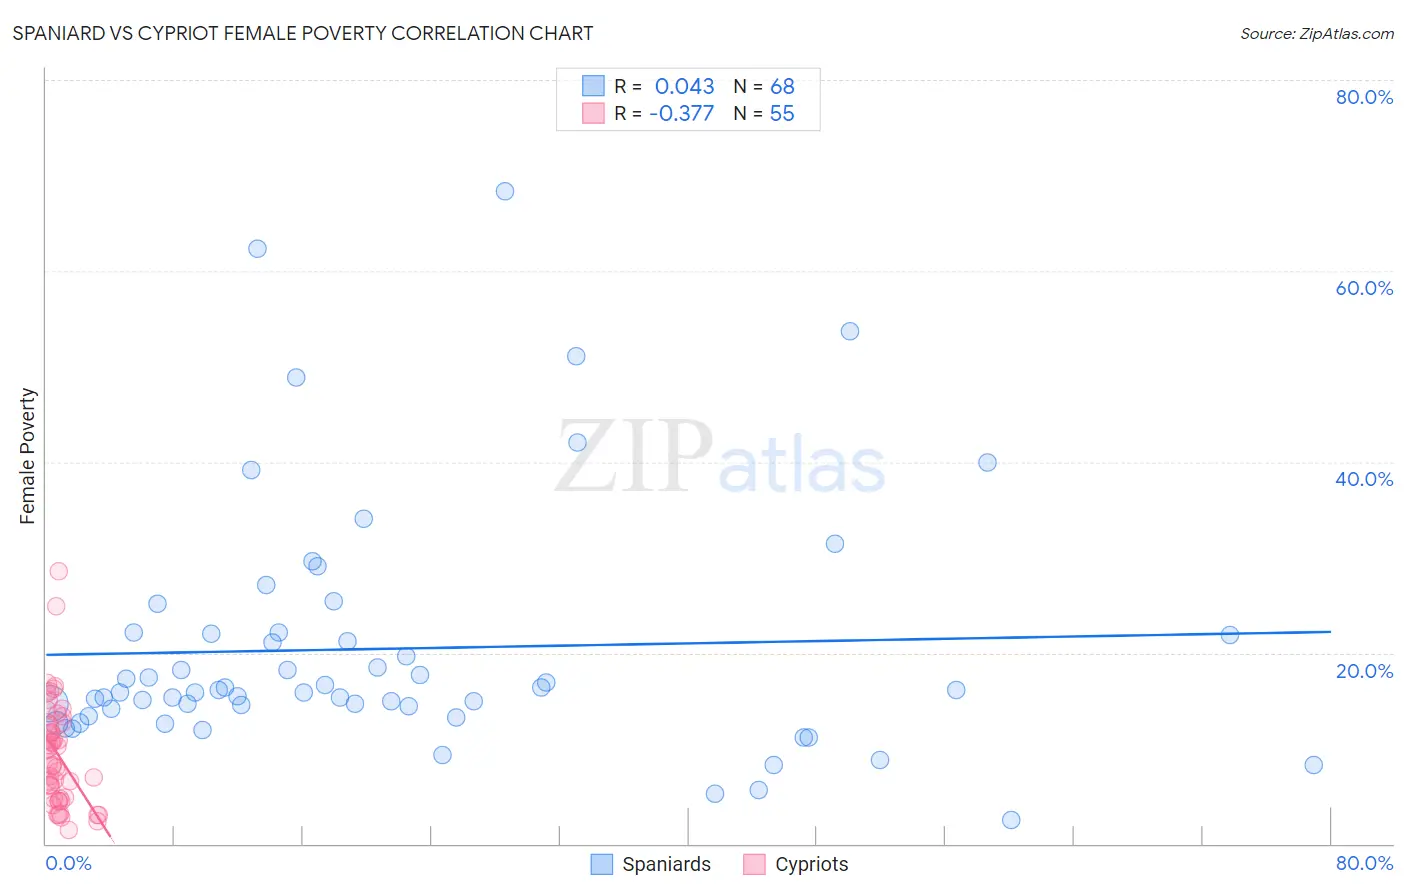
Spaniard vs Cypriot Female Poverty Correlation Chart
The statistical analysis conducted on geographies consisting of 443,063,734 people shows no correlation between the proportion of Spaniards and poverty level among females in the United States with a correlation coefficient (R) of 0.043 and weighted average of 13.9%. Similarly, the statistical analysis conducted on geographies consisting of 61,838,205 people shows a mild negative correlation between the proportion of Cypriots and poverty level among females in the United States with a correlation coefficient (R) of -0.377 and weighted average of 11.8%, a difference of 18.4%.
Female Poverty Correlation Summary
| Measurement | Spaniard | Cypriot |
| Minimum | 2.5% | 1.5% |
| Maximum | 68.3% | 28.6% |
| Range | 65.9% | 27.1% |
| Mean | 20.4% | 9.4% |
| Median | 15.9% | 8.5% |
| Interquartile 25% (IQ1) | 13.8% | 4.7% |
| Interquartile 75% (IQ3) | 22.0% | 12.6% |
| Interquartile Range (IQR) | 8.3% | 7.9% |
| Standard Deviation (Sample) | 13.0% | 5.5% |
| Standard Deviation (Population) | 12.9% | 5.4% |
Similar Demographics by Female Poverty
Demographics Similar to Spaniards by Female Poverty
In terms of female poverty, the demographic groups most similar to Spaniards are Immigrants from Western Asia (13.9%, a difference of 0.27%), Hmong (13.9%, a difference of 0.32%), Immigrants from Kenya (13.9%, a difference of 0.33%), Spanish (13.9%, a difference of 0.37%), and Ugandan (14.0%, a difference of 0.56%).
| Demographics | Rating | Rank | Female Poverty |
| Arabs | 28.6 /100 | #197 | Fair 13.7% |
| Immigrants | Uganda | 28.5 /100 | #198 | Fair 13.7% |
| Immigrants | Lebanon | 25.6 /100 | #199 | Fair 13.8% |
| Spanish | 21.4 /100 | #200 | Fair 13.9% |
| Immigrants | Kenya | 21.1 /100 | #201 | Fair 13.9% |
| Hmong | 21.1 /100 | #202 | Fair 13.9% |
| Immigrants | Western Asia | 20.7 /100 | #203 | Fair 13.9% |
| Spaniards | 18.9 /100 | #204 | Poor 13.9% |
| Ugandans | 15.4 /100 | #205 | Poor 14.0% |
| Immigrants | Uruguay | 14.0 /100 | #206 | Poor 14.0% |
| Immigrants | Eastern Africa | 9.0 /100 | #207 | Tragic 14.2% |
| Immigrants | Azores | 7.9 /100 | #208 | Tragic 14.2% |
| Panamanians | 7.7 /100 | #209 | Tragic 14.2% |
| Malaysians | 7.4 /100 | #210 | Tragic 14.3% |
| Moroccans | 7.2 /100 | #211 | Tragic 14.3% |
Demographics Similar to Cypriots by Female Poverty
In terms of female poverty, the demographic groups most similar to Cypriots are Danish (11.7%, a difference of 0.070%), Immigrants from Singapore (11.8%, a difference of 0.12%), Polish (11.7%, a difference of 0.21%), Immigrants from Iran (11.8%, a difference of 0.29%), and Greek (11.7%, a difference of 0.42%).
| Demographics | Rating | Rank | Female Poverty |
| Croatians | 99.6 /100 | #26 | Exceptional 11.6% |
| Iranians | 99.6 /100 | #27 | Exceptional 11.7% |
| Immigrants | Korea | 99.6 /100 | #28 | Exceptional 11.7% |
| Immigrants | North Macedonia | 99.6 /100 | #29 | Exceptional 11.7% |
| Greeks | 99.5 /100 | #30 | Exceptional 11.7% |
| Poles | 99.5 /100 | #31 | Exceptional 11.7% |
| Danes | 99.5 /100 | #32 | Exceptional 11.7% |
| Cypriots | 99.5 /100 | #33 | Exceptional 11.8% |
| Immigrants | Singapore | 99.4 /100 | #34 | Exceptional 11.8% |
| Immigrants | Iran | 99.4 /100 | #35 | Exceptional 11.8% |
| Immigrants | Pakistan | 99.4 /100 | #36 | Exceptional 11.8% |
| Immigrants | Greece | 99.3 /100 | #37 | Exceptional 11.8% |
| Russians | 99.3 /100 | #38 | Exceptional 11.8% |
| Immigrants | Poland | 99.3 /100 | #39 | Exceptional 11.8% |
| Macedonians | 99.3 /100 | #40 | Exceptional 11.8% |