Spaniard vs Barbadian 8th Grade
COMPARE
Spaniard
Barbadian
8th Grade
8th Grade Comparison
Spaniards
Barbadians
95.8%
8TH GRADE
60.0/ 100
METRIC RATING
167th/ 347
METRIC RANK
94.6%
8TH GRADE
0.1/ 100
METRIC RATING
280th/ 347
METRIC RANK
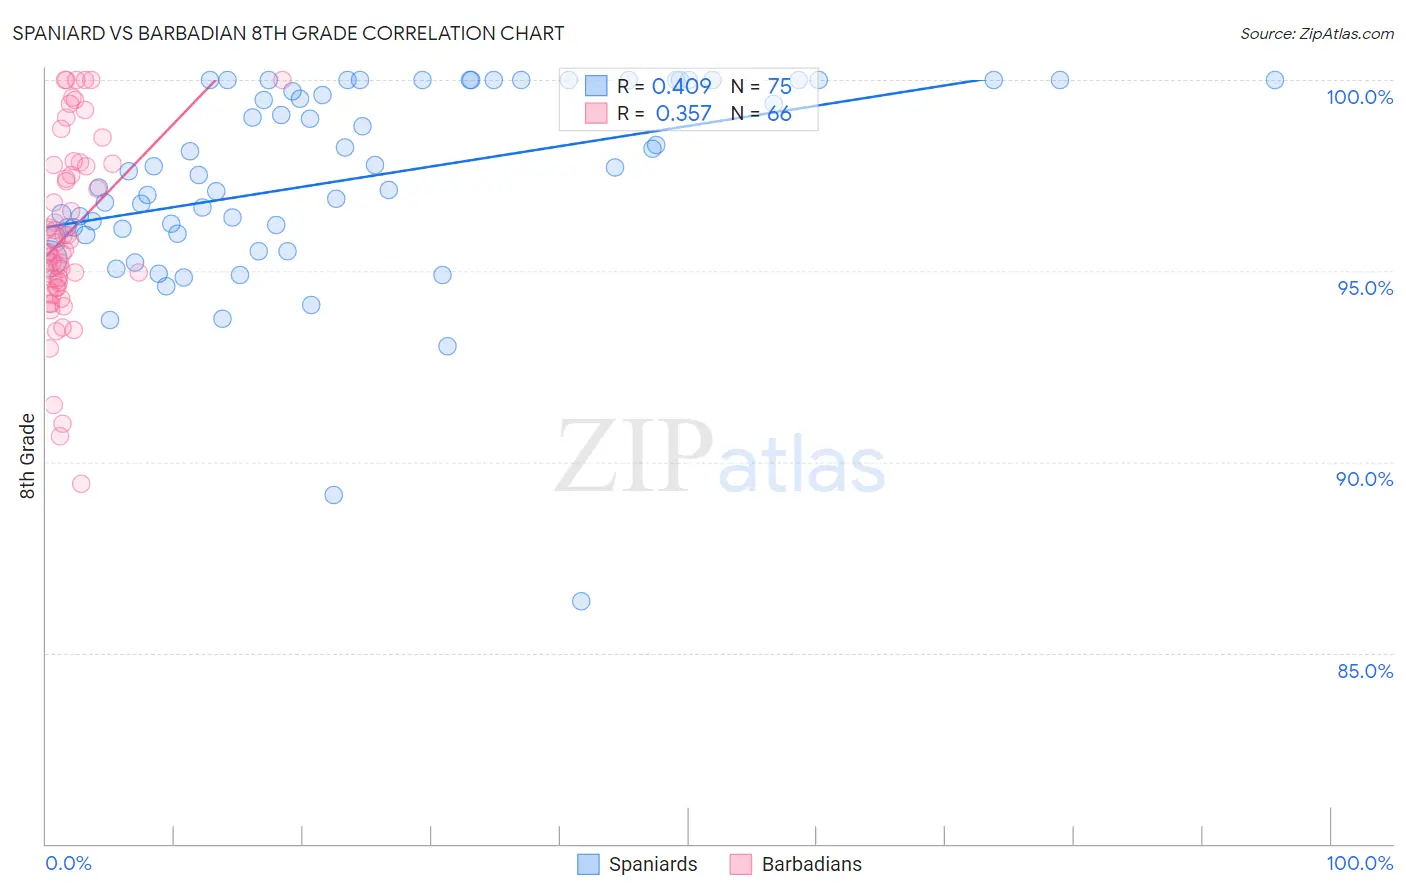
Spaniard vs Barbadian 8th Grade Correlation Chart
The statistical analysis conducted on geographies consisting of 443,544,503 people shows a moderate positive correlation between the proportion of Spaniards and percentage of population with at least 8th grade education in the United States with a correlation coefficient (R) of 0.409 and weighted average of 95.8%. Similarly, the statistical analysis conducted on geographies consisting of 141,299,217 people shows a mild positive correlation between the proportion of Barbadians and percentage of population with at least 8th grade education in the United States with a correlation coefficient (R) of 0.357 and weighted average of 94.6%, a difference of 1.2%.
8th Grade Correlation Summary
| Measurement | Spaniard | Barbadian |
| Minimum | 86.4% | 89.4% |
| Maximum | 100.0% | 100.0% |
| Range | 13.6% | 10.6% |
| Mean | 97.4% | 96.0% |
| Median | 97.6% | 95.5% |
| Interquartile 25% (IQ1) | 96.0% | 94.6% |
| Interquartile 75% (IQ3) | 100.0% | 97.8% |
| Interquartile Range (IQR) | 4.0% | 3.2% |
| Standard Deviation (Sample) | 2.6% | 2.4% |
| Standard Deviation (Population) | 2.6% | 2.4% |
Similar Demographics by 8th Grade
Demographics Similar to Spaniards by 8th Grade
In terms of 8th grade, the demographic groups most similar to Spaniards are Immigrants from Ukraine (95.8%, a difference of 0.0%), Alsatian (95.8%, a difference of 0.010%), Immigrants from Poland (95.8%, a difference of 0.010%), Immigrants from Iran (95.8%, a difference of 0.010%), and Ute (95.8%, a difference of 0.010%).
| Demographics | Rating | Rank | 8th Grade |
| Seminole | 67.7 /100 | #160 | Good 95.8% |
| Bermudans | 67.5 /100 | #161 | Good 95.8% |
| Immigrants | Kenya | 67.2 /100 | #162 | Good 95.8% |
| Immigrants | Sri Lanka | 64.1 /100 | #163 | Good 95.8% |
| Immigrants | Italy | 63.5 /100 | #164 | Good 95.8% |
| Alsatians | 61.4 /100 | #165 | Good 95.8% |
| Immigrants | Poland | 61.1 /100 | #166 | Good 95.8% |
| Spaniards | 60.0 /100 | #167 | Good 95.8% |
| Immigrants | Ukraine | 59.5 /100 | #168 | Average 95.8% |
| Immigrants | Iran | 58.6 /100 | #169 | Average 95.8% |
| Ute | 58.5 /100 | #170 | Average 95.8% |
| Egyptians | 58.2 /100 | #171 | Average 95.8% |
| Immigrants | Korea | 57.9 /100 | #172 | Average 95.8% |
| Mongolians | 53.0 /100 | #173 | Average 95.8% |
| Chileans | 50.0 /100 | #174 | Average 95.7% |
Demographics Similar to Barbadians by 8th Grade
In terms of 8th grade, the demographic groups most similar to Barbadians are Immigrants from Trinidad and Tobago (94.6%, a difference of 0.0%), Immigrants from Bolivia (94.6%, a difference of 0.0%), Armenian (94.7%, a difference of 0.010%), Taiwanese (94.7%, a difference of 0.040%), and Immigrants from Eritrea (94.6%, a difference of 0.040%).
| Demographics | Rating | Rank | 8th Grade |
| Immigrants | Western Africa | 0.2 /100 | #273 | Tragic 94.8% |
| Trinidadians and Tobagonians | 0.2 /100 | #274 | Tragic 94.7% |
| Immigrants | Colombia | 0.2 /100 | #275 | Tragic 94.7% |
| Peruvians | 0.1 /100 | #276 | Tragic 94.7% |
| Taiwanese | 0.1 /100 | #277 | Tragic 94.7% |
| Armenians | 0.1 /100 | #278 | Tragic 94.7% |
| Immigrants | Trinidad and Tobago | 0.1 /100 | #279 | Tragic 94.6% |
| Barbadians | 0.1 /100 | #280 | Tragic 94.6% |
| Immigrants | Bolivia | 0.1 /100 | #281 | Tragic 94.6% |
| Immigrants | Eritrea | 0.1 /100 | #282 | Tragic 94.6% |
| Immigrants | St. Vincent and the Grenadines | 0.1 /100 | #283 | Tragic 94.6% |
| Immigrants | Philippines | 0.1 /100 | #284 | Tragic 94.6% |
| Immigrants | Barbados | 0.0 /100 | #285 | Tragic 94.5% |
| Immigrants | Peru | 0.0 /100 | #286 | Tragic 94.5% |
| Tohono O'odham | 0.0 /100 | #287 | Tragic 94.5% |