Immigrants from Latin America vs Barbadian Female Poverty
COMPARE
Immigrants from Latin America
Barbadian
Female Poverty
Female Poverty Comparison
Immigrants from Latin America
Barbadians
16.4%
FEMALE POVERTY
0.0/ 100
METRIC RATING
293rd/ 347
METRIC RANK
15.9%
FEMALE POVERTY
0.0/ 100
METRIC RATING
274th/ 347
METRIC RANK
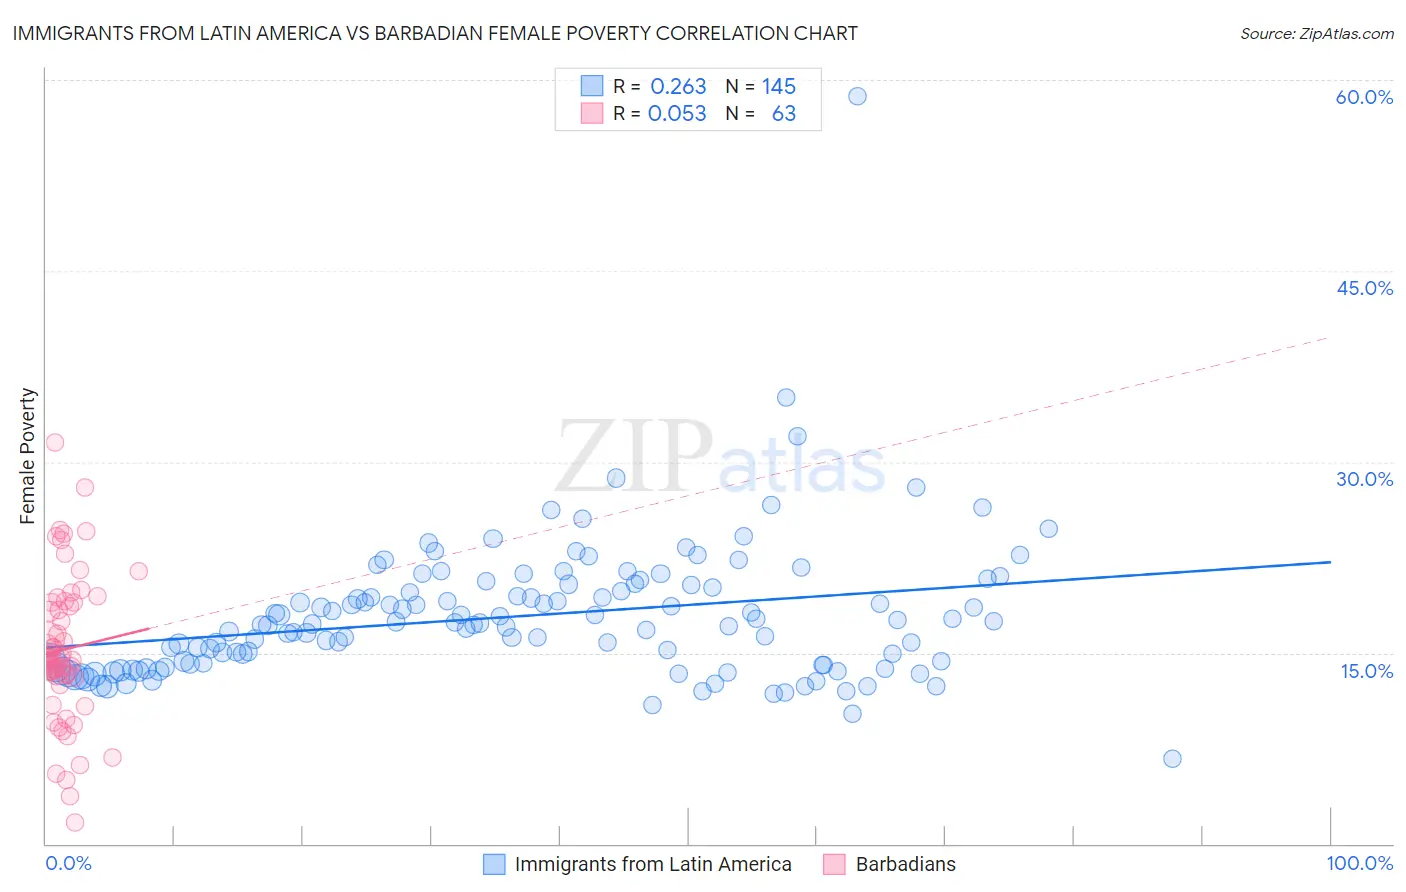
Immigrants from Latin America vs Barbadian Female Poverty Correlation Chart
The statistical analysis conducted on geographies consisting of 557,630,334 people shows a weak positive correlation between the proportion of Immigrants from Latin America and poverty level among females in the United States with a correlation coefficient (R) of 0.263 and weighted average of 16.4%. Similarly, the statistical analysis conducted on geographies consisting of 141,263,328 people shows a slight positive correlation between the proportion of Barbadians and poverty level among females in the United States with a correlation coefficient (R) of 0.053 and weighted average of 15.9%, a difference of 3.1%.
Female Poverty Correlation Summary
| Measurement | Immigrants from Latin America | Barbadian |
| Minimum | 6.7% | 1.7% |
| Maximum | 58.7% | 31.5% |
| Range | 52.1% | 29.8% |
| Mean | 17.9% | 15.3% |
| Median | 17.2% | 14.6% |
| Interquartile 25% (IQ1) | 14.0% | 13.0% |
| Interquartile 75% (IQ3) | 20.2% | 18.9% |
| Interquartile Range (IQR) | 6.2% | 5.9% |
| Standard Deviation (Sample) | 5.5% | 5.8% |
| Standard Deviation (Population) | 5.5% | 5.8% |
Demographics Similar to Immigrants from Latin America and Barbadians by Female Poverty
In terms of female poverty, the demographic groups most similar to Immigrants from Latin America are Immigrants from Zaire (16.4%, a difference of 0.060%), Yaqui (16.4%, a difference of 0.070%), Immigrants from Bangladesh (16.4%, a difference of 0.23%), Blackfeet (16.4%, a difference of 0.42%), and Indonesian (16.4%, a difference of 0.43%). Similarly, the demographic groups most similar to Barbadians are Haitian (15.9%, a difference of 0.0%), Immigrants from Barbados (16.0%, a difference of 0.070%), Central American (16.0%, a difference of 0.19%), Bangladeshi (16.0%, a difference of 0.38%), and Immigrants from West Indies (16.1%, a difference of 0.69%).
| Demographics | Rating | Rank | Female Poverty |
| Haitians | 0.0 /100 | #273 | Tragic 15.9% |
| Barbadians | 0.0 /100 | #274 | Tragic 15.9% |
| Immigrants | Barbados | 0.0 /100 | #275 | Tragic 16.0% |
| Central Americans | 0.0 /100 | #276 | Tragic 16.0% |
| Bangladeshis | 0.0 /100 | #277 | Tragic 16.0% |
| Immigrants | West Indies | 0.0 /100 | #278 | Tragic 16.1% |
| Immigrants | Bahamas | 0.0 /100 | #279 | Tragic 16.1% |
| Vietnamese | 0.0 /100 | #280 | Tragic 16.1% |
| West Indians | 0.0 /100 | #281 | Tragic 16.1% |
| Immigrants | Haiti | 0.0 /100 | #282 | Tragic 16.1% |
| Immigrants | Cuba | 0.0 /100 | #283 | Tragic 16.1% |
| Spanish Americans | 0.0 /100 | #284 | Tragic 16.2% |
| Comanche | 0.0 /100 | #285 | Tragic 16.2% |
| Inupiat | 0.0 /100 | #286 | Tragic 16.2% |
| Immigrants | Belize | 0.0 /100 | #287 | Tragic 16.3% |
| Indonesians | 0.0 /100 | #288 | Tragic 16.4% |
| Blackfeet | 0.0 /100 | #289 | Tragic 16.4% |
| Immigrants | Bangladesh | 0.0 /100 | #290 | Tragic 16.4% |
| Yaqui | 0.0 /100 | #291 | Tragic 16.4% |
| Immigrants | Zaire | 0.0 /100 | #292 | Tragic 16.4% |
| Immigrants | Latin America | 0.0 /100 | #293 | Tragic 16.4% |