Immigrants from Greece vs Barbadian Female Poverty
COMPARE
Immigrants from Greece
Barbadian
Female Poverty
Female Poverty Comparison
Immigrants from Greece
Barbadians
11.8%
FEMALE POVERTY
99.3/ 100
METRIC RATING
37th/ 347
METRIC RANK
15.9%
FEMALE POVERTY
0.0/ 100
METRIC RATING
274th/ 347
METRIC RANK
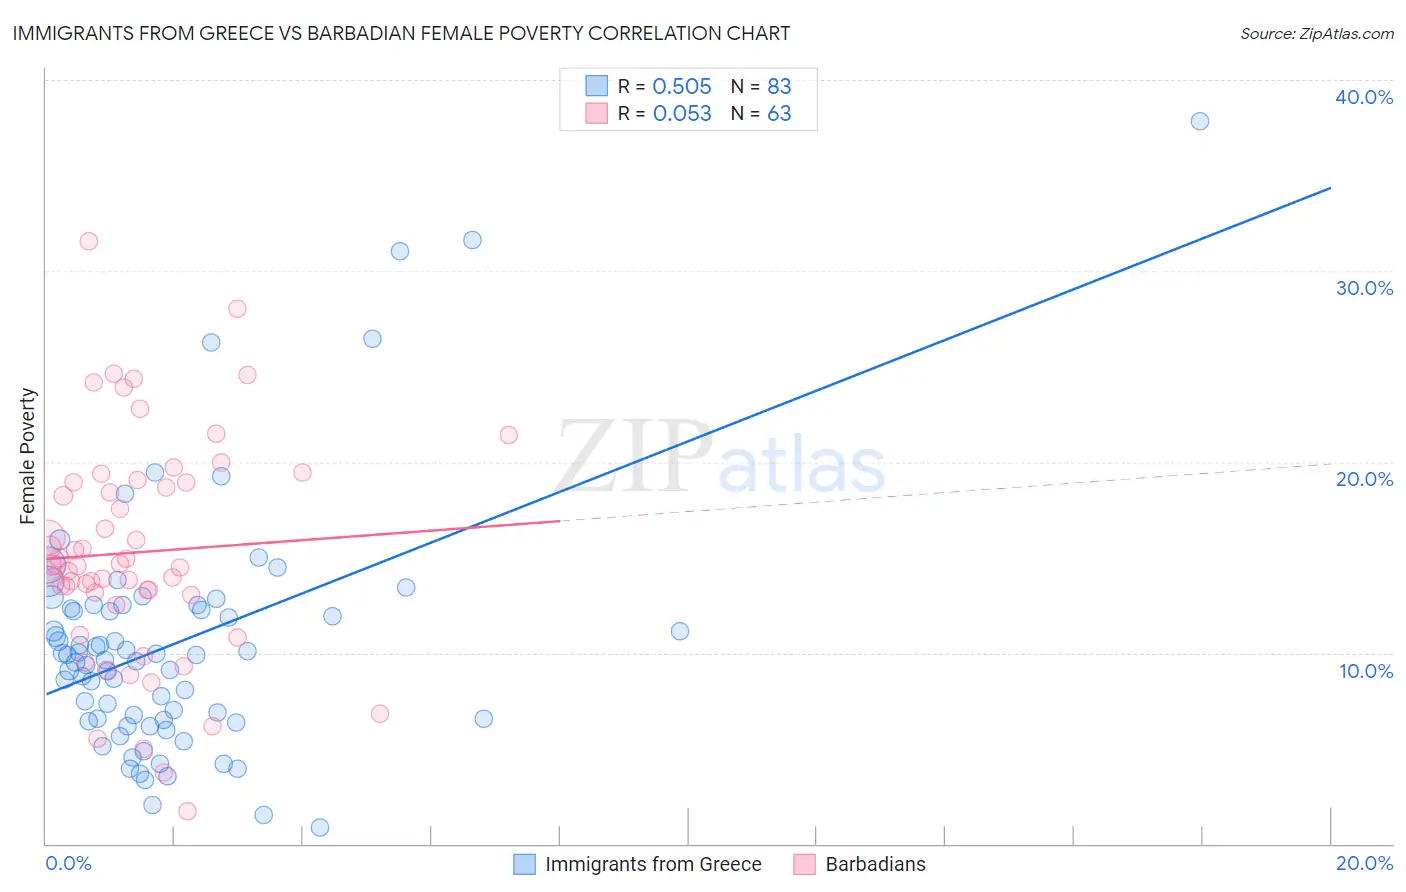
Immigrants from Greece vs Barbadian Female Poverty Correlation Chart
The statistical analysis conducted on geographies consisting of 216,839,039 people shows a substantial positive correlation between the proportion of Immigrants from Greece and poverty level among females in the United States with a correlation coefficient (R) of 0.505 and weighted average of 11.8%. Similarly, the statistical analysis conducted on geographies consisting of 141,263,328 people shows a slight positive correlation between the proportion of Barbadians and poverty level among females in the United States with a correlation coefficient (R) of 0.053 and weighted average of 15.9%, a difference of 34.9%.
Female Poverty Correlation Summary
| Measurement | Immigrants from Greece | Barbadian |
| Minimum | 0.85% | 1.7% |
| Maximum | 37.8% | 31.5% |
| Range | 37.0% | 29.8% |
| Mean | 10.5% | 15.3% |
| Median | 9.9% | 14.6% |
| Interquartile 25% (IQ1) | 6.5% | 13.0% |
| Interquartile 75% (IQ3) | 12.5% | 18.9% |
| Interquartile Range (IQR) | 6.0% | 5.9% |
| Standard Deviation (Sample) | 6.5% | 5.8% |
| Standard Deviation (Population) | 6.4% | 5.8% |
Similar Demographics by Female Poverty
Demographics Similar to Immigrants from Greece by Female Poverty
In terms of female poverty, the demographic groups most similar to Immigrants from Greece are Russian (11.8%, a difference of 0.020%), Immigrants from Pakistan (11.8%, a difference of 0.10%), Immigrants from Poland (11.8%, a difference of 0.22%), Immigrants from Iran (11.8%, a difference of 0.27%), and Macedonian (11.8%, a difference of 0.27%).
| Demographics | Rating | Rank | Female Poverty |
| Greeks | 99.5 /100 | #30 | Exceptional 11.7% |
| Poles | 99.5 /100 | #31 | Exceptional 11.7% |
| Danes | 99.5 /100 | #32 | Exceptional 11.7% |
| Cypriots | 99.5 /100 | #33 | Exceptional 11.8% |
| Immigrants | Singapore | 99.4 /100 | #34 | Exceptional 11.8% |
| Immigrants | Iran | 99.4 /100 | #35 | Exceptional 11.8% |
| Immigrants | Pakistan | 99.4 /100 | #36 | Exceptional 11.8% |
| Immigrants | Greece | 99.3 /100 | #37 | Exceptional 11.8% |
| Russians | 99.3 /100 | #38 | Exceptional 11.8% |
| Immigrants | Poland | 99.3 /100 | #39 | Exceptional 11.8% |
| Macedonians | 99.3 /100 | #40 | Exceptional 11.8% |
| Czechs | 99.2 /100 | #41 | Exceptional 11.9% |
| Immigrants | Moldova | 99.2 /100 | #42 | Exceptional 11.9% |
| Koreans | 99.2 /100 | #43 | Exceptional 11.9% |
| Tongans | 99.2 /100 | #44 | Exceptional 11.9% |
Demographics Similar to Barbadians by Female Poverty
In terms of female poverty, the demographic groups most similar to Barbadians are Haitian (15.9%, a difference of 0.0%), Belizean (15.9%, a difference of 0.010%), Immigrants from Barbados (16.0%, a difference of 0.070%), Central American (16.0%, a difference of 0.19%), and Immigrants from St. Vincent and the Grenadines (15.9%, a difference of 0.24%).
| Demographics | Rating | Rank | Female Poverty |
| Sub-Saharan Africans | 0.1 /100 | #267 | Tragic 15.8% |
| Immigrants | Nicaragua | 0.1 /100 | #268 | Tragic 15.8% |
| Iroquois | 0.1 /100 | #269 | Tragic 15.8% |
| Chickasaw | 0.1 /100 | #270 | Tragic 15.9% |
| Immigrants | St. Vincent and the Grenadines | 0.0 /100 | #271 | Tragic 15.9% |
| Belizeans | 0.0 /100 | #272 | Tragic 15.9% |
| Haitians | 0.0 /100 | #273 | Tragic 15.9% |
| Barbadians | 0.0 /100 | #274 | Tragic 15.9% |
| Immigrants | Barbados | 0.0 /100 | #275 | Tragic 16.0% |
| Central Americans | 0.0 /100 | #276 | Tragic 16.0% |
| Bangladeshis | 0.0 /100 | #277 | Tragic 16.0% |
| Immigrants | West Indies | 0.0 /100 | #278 | Tragic 16.1% |
| Immigrants | Bahamas | 0.0 /100 | #279 | Tragic 16.1% |
| Vietnamese | 0.0 /100 | #280 | Tragic 16.1% |
| West Indians | 0.0 /100 | #281 | Tragic 16.1% |