Korean vs Barbadian Female Poverty
COMPARE
Korean
Barbadian
Female Poverty
Female Poverty Comparison
Koreans
Barbadians
11.9%
FEMALE POVERTY
99.2/ 100
METRIC RATING
43rd/ 347
METRIC RANK
15.9%
FEMALE POVERTY
0.0/ 100
METRIC RATING
274th/ 347
METRIC RANK
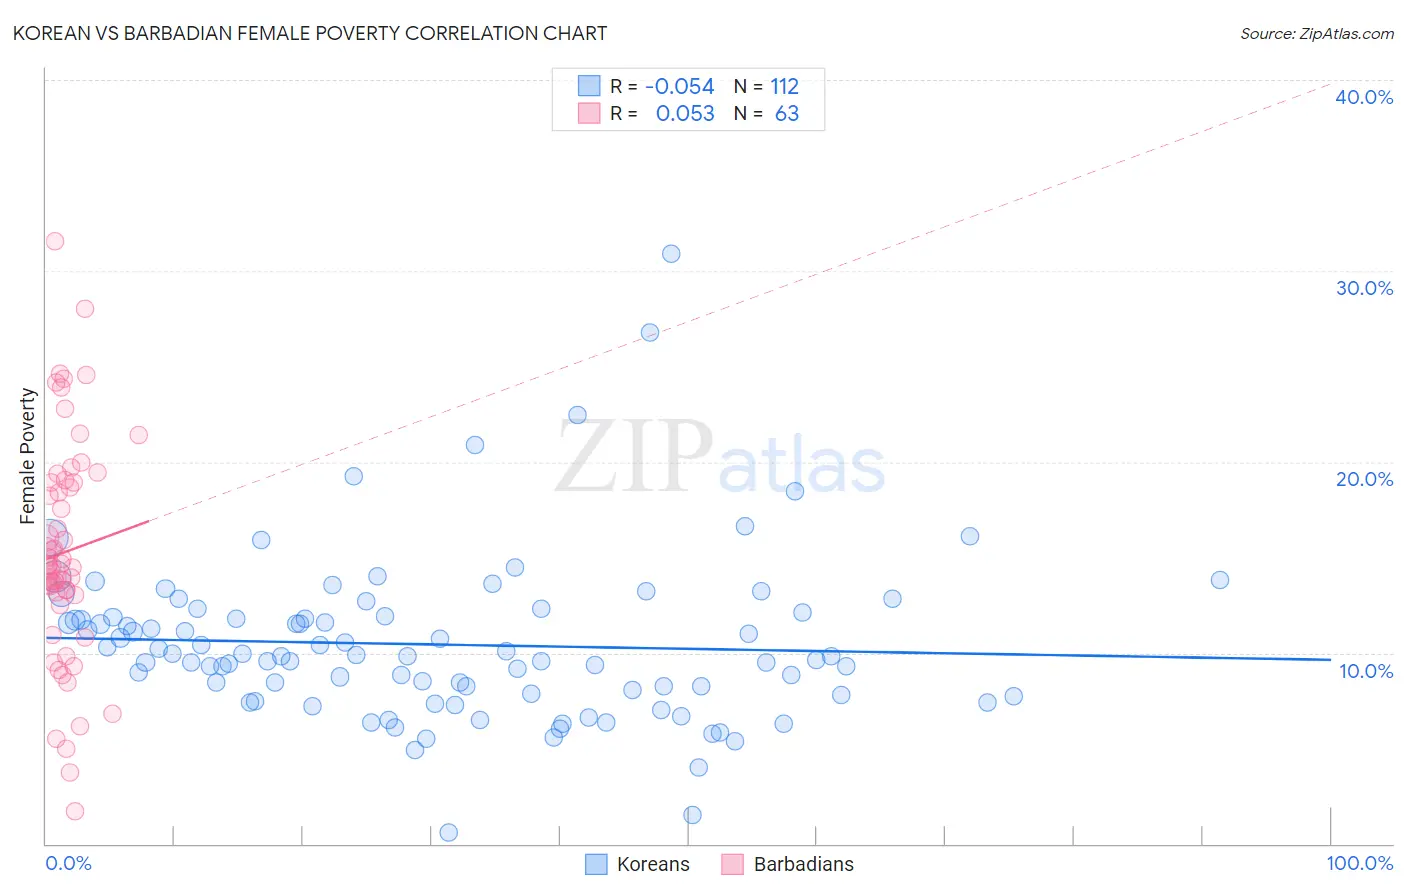
Korean vs Barbadian Female Poverty Correlation Chart
The statistical analysis conducted on geographies consisting of 510,221,953 people shows a slight negative correlation between the proportion of Koreans and poverty level among females in the United States with a correlation coefficient (R) of -0.054 and weighted average of 11.9%. Similarly, the statistical analysis conducted on geographies consisting of 141,263,328 people shows a slight positive correlation between the proportion of Barbadians and poverty level among females in the United States with a correlation coefficient (R) of 0.053 and weighted average of 15.9%, a difference of 34.2%.
Female Poverty Correlation Summary
| Measurement | Korean | Barbadian |
| Minimum | 0.57% | 1.7% |
| Maximum | 30.9% | 31.5% |
| Range | 30.3% | 29.8% |
| Mean | 10.4% | 15.3% |
| Median | 9.8% | 14.6% |
| Interquartile 25% (IQ1) | 7.9% | 13.0% |
| Interquartile 75% (IQ3) | 11.9% | 18.9% |
| Interquartile Range (IQR) | 4.0% | 5.9% |
| Standard Deviation (Sample) | 4.3% | 5.8% |
| Standard Deviation (Population) | 4.3% | 5.8% |
Similar Demographics by Female Poverty
Demographics Similar to Koreans by Female Poverty
In terms of female poverty, the demographic groups most similar to Koreans are Czech (11.9%, a difference of 0.040%), Immigrants from Moldova (11.9%, a difference of 0.040%), Tongan (11.9%, a difference of 0.070%), Immigrants from Czechoslovakia (11.9%, a difference of 0.16%), and Turkish (11.9%, a difference of 0.16%).
| Demographics | Rating | Rank | Female Poverty |
| Immigrants | Pakistan | 99.4 /100 | #36 | Exceptional 11.8% |
| Immigrants | Greece | 99.3 /100 | #37 | Exceptional 11.8% |
| Russians | 99.3 /100 | #38 | Exceptional 11.8% |
| Immigrants | Poland | 99.3 /100 | #39 | Exceptional 11.8% |
| Macedonians | 99.3 /100 | #40 | Exceptional 11.8% |
| Czechs | 99.2 /100 | #41 | Exceptional 11.9% |
| Immigrants | Moldova | 99.2 /100 | #42 | Exceptional 11.9% |
| Koreans | 99.2 /100 | #43 | Exceptional 11.9% |
| Tongans | 99.2 /100 | #44 | Exceptional 11.9% |
| Immigrants | Czechoslovakia | 99.2 /100 | #45 | Exceptional 11.9% |
| Turks | 99.2 /100 | #46 | Exceptional 11.9% |
| Asians | 99.1 /100 | #47 | Exceptional 11.9% |
| Immigrants | Japan | 99.0 /100 | #48 | Exceptional 11.9% |
| Immigrants | Romania | 99.0 /100 | #49 | Exceptional 12.0% |
| Slovenes | 98.9 /100 | #50 | Exceptional 12.0% |
Demographics Similar to Barbadians by Female Poverty
In terms of female poverty, the demographic groups most similar to Barbadians are Haitian (15.9%, a difference of 0.0%), Belizean (15.9%, a difference of 0.010%), Immigrants from Barbados (16.0%, a difference of 0.070%), Central American (16.0%, a difference of 0.19%), and Immigrants from St. Vincent and the Grenadines (15.9%, a difference of 0.24%).
| Demographics | Rating | Rank | Female Poverty |
| Sub-Saharan Africans | 0.1 /100 | #267 | Tragic 15.8% |
| Immigrants | Nicaragua | 0.1 /100 | #268 | Tragic 15.8% |
| Iroquois | 0.1 /100 | #269 | Tragic 15.8% |
| Chickasaw | 0.1 /100 | #270 | Tragic 15.9% |
| Immigrants | St. Vincent and the Grenadines | 0.0 /100 | #271 | Tragic 15.9% |
| Belizeans | 0.0 /100 | #272 | Tragic 15.9% |
| Haitians | 0.0 /100 | #273 | Tragic 15.9% |
| Barbadians | 0.0 /100 | #274 | Tragic 15.9% |
| Immigrants | Barbados | 0.0 /100 | #275 | Tragic 16.0% |
| Central Americans | 0.0 /100 | #276 | Tragic 16.0% |
| Bangladeshis | 0.0 /100 | #277 | Tragic 16.0% |
| Immigrants | West Indies | 0.0 /100 | #278 | Tragic 16.1% |
| Immigrants | Bahamas | 0.0 /100 | #279 | Tragic 16.1% |
| Vietnamese | 0.0 /100 | #280 | Tragic 16.1% |
| West Indians | 0.0 /100 | #281 | Tragic 16.1% |