Spaniard vs Immigrants from Haiti Female Poverty
COMPARE
Spaniard
Immigrants from Haiti
Female Poverty
Female Poverty Comparison
Spaniards
Immigrants from Haiti
13.9%
FEMALE POVERTY
18.9/ 100
METRIC RATING
204th/ 347
METRIC RANK
16.1%
FEMALE POVERTY
0.0/ 100
METRIC RATING
282nd/ 347
METRIC RANK
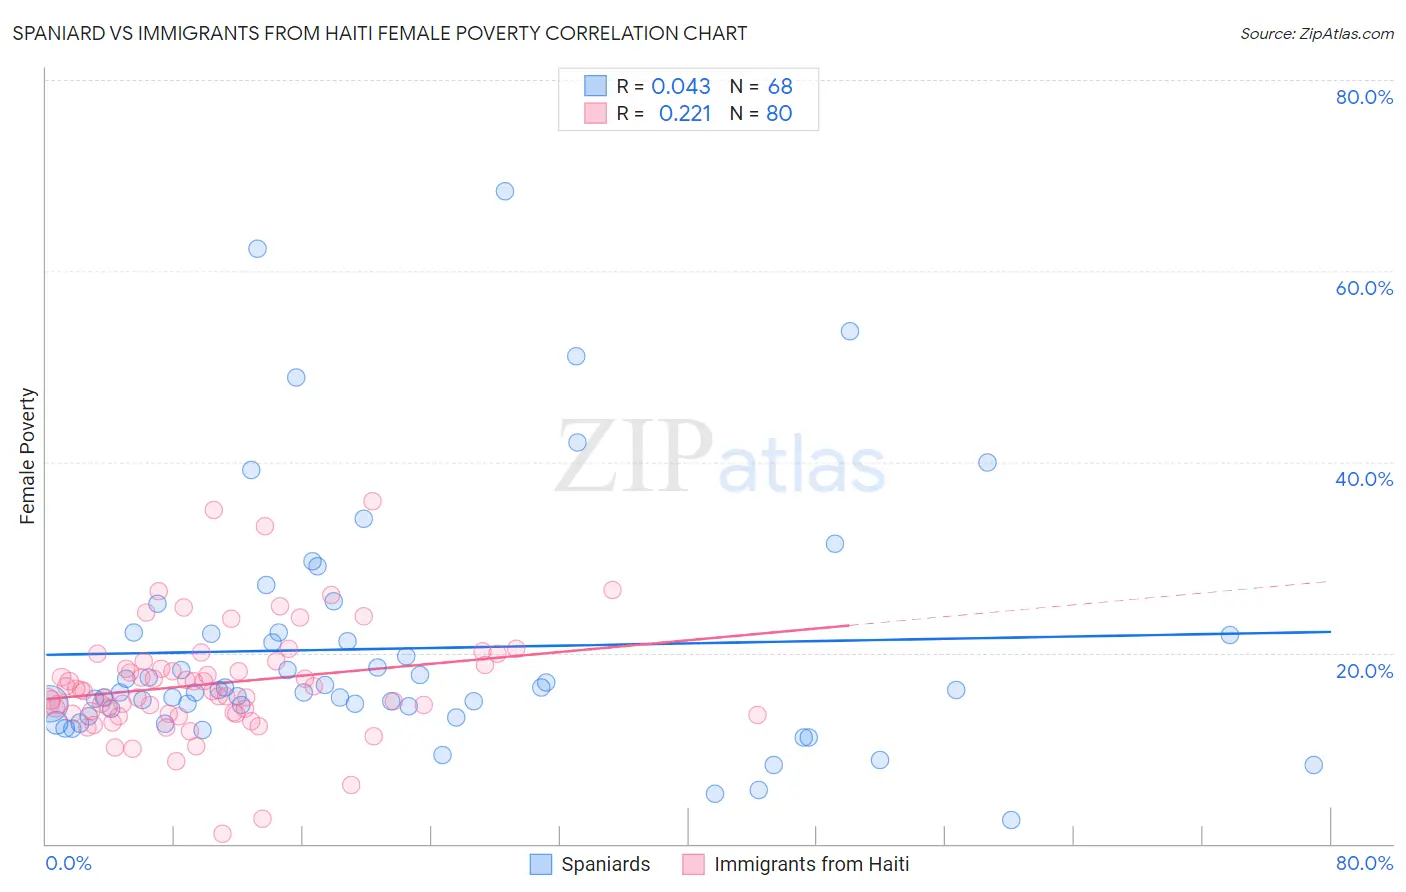
Spaniard vs Immigrants from Haiti Female Poverty Correlation Chart
The statistical analysis conducted on geographies consisting of 443,063,734 people shows no correlation between the proportion of Spaniards and poverty level among females in the United States with a correlation coefficient (R) of 0.043 and weighted average of 13.9%. Similarly, the statistical analysis conducted on geographies consisting of 225,156,546 people shows a weak positive correlation between the proportion of Immigrants from Haiti and poverty level among females in the United States with a correlation coefficient (R) of 0.221 and weighted average of 16.1%, a difference of 16.0%.
Female Poverty Correlation Summary
| Measurement | Spaniard | Immigrants from Haiti |
| Minimum | 2.5% | 1.1% |
| Maximum | 68.3% | 35.8% |
| Range | 65.9% | 34.7% |
| Mean | 20.4% | 16.8% |
| Median | 15.9% | 16.0% |
| Interquartile 25% (IQ1) | 13.8% | 13.6% |
| Interquartile 75% (IQ3) | 22.0% | 19.0% |
| Interquartile Range (IQR) | 8.3% | 5.3% |
| Standard Deviation (Sample) | 13.0% | 5.9% |
| Standard Deviation (Population) | 12.9% | 5.9% |
Similar Demographics by Female Poverty
Demographics Similar to Spaniards by Female Poverty
In terms of female poverty, the demographic groups most similar to Spaniards are Immigrants from Western Asia (13.9%, a difference of 0.27%), Hmong (13.9%, a difference of 0.32%), Immigrants from Kenya (13.9%, a difference of 0.33%), Spanish (13.9%, a difference of 0.37%), and Ugandan (14.0%, a difference of 0.56%).
| Demographics | Rating | Rank | Female Poverty |
| Arabs | 28.6 /100 | #197 | Fair 13.7% |
| Immigrants | Uganda | 28.5 /100 | #198 | Fair 13.7% |
| Immigrants | Lebanon | 25.6 /100 | #199 | Fair 13.8% |
| Spanish | 21.4 /100 | #200 | Fair 13.9% |
| Immigrants | Kenya | 21.1 /100 | #201 | Fair 13.9% |
| Hmong | 21.1 /100 | #202 | Fair 13.9% |
| Immigrants | Western Asia | 20.7 /100 | #203 | Fair 13.9% |
| Spaniards | 18.9 /100 | #204 | Poor 13.9% |
| Ugandans | 15.4 /100 | #205 | Poor 14.0% |
| Immigrants | Uruguay | 14.0 /100 | #206 | Poor 14.0% |
| Immigrants | Eastern Africa | 9.0 /100 | #207 | Tragic 14.2% |
| Immigrants | Azores | 7.9 /100 | #208 | Tragic 14.2% |
| Panamanians | 7.7 /100 | #209 | Tragic 14.2% |
| Malaysians | 7.4 /100 | #210 | Tragic 14.3% |
| Moroccans | 7.2 /100 | #211 | Tragic 14.3% |
Demographics Similar to Immigrants from Haiti by Female Poverty
In terms of female poverty, the demographic groups most similar to Immigrants from Haiti are Immigrants from Cuba (16.1%, a difference of 0.080%), Spanish American (16.2%, a difference of 0.13%), West Indian (16.1%, a difference of 0.15%), Vietnamese (16.1%, a difference of 0.17%), and Comanche (16.2%, a difference of 0.21%).
| Demographics | Rating | Rank | Female Poverty |
| Immigrants | Barbados | 0.0 /100 | #275 | Tragic 16.0% |
| Central Americans | 0.0 /100 | #276 | Tragic 16.0% |
| Bangladeshis | 0.0 /100 | #277 | Tragic 16.0% |
| Immigrants | West Indies | 0.0 /100 | #278 | Tragic 16.1% |
| Immigrants | Bahamas | 0.0 /100 | #279 | Tragic 16.1% |
| Vietnamese | 0.0 /100 | #280 | Tragic 16.1% |
| West Indians | 0.0 /100 | #281 | Tragic 16.1% |
| Immigrants | Haiti | 0.0 /100 | #282 | Tragic 16.1% |
| Immigrants | Cuba | 0.0 /100 | #283 | Tragic 16.1% |
| Spanish Americans | 0.0 /100 | #284 | Tragic 16.2% |
| Comanche | 0.0 /100 | #285 | Tragic 16.2% |
| Inupiat | 0.0 /100 | #286 | Tragic 16.2% |
| Immigrants | Belize | 0.0 /100 | #287 | Tragic 16.3% |
| Indonesians | 0.0 /100 | #288 | Tragic 16.4% |
| Blackfeet | 0.0 /100 | #289 | Tragic 16.4% |