Spaniard vs Barbadian Unemployment Among Women with Children Ages 6 to 17 years
COMPARE
Spaniard
Barbadian
Unemployment Among Women with Children Ages 6 to 17 years
Unemployment Among Women with Children Ages 6 to 17 years Comparison
Spaniards
Barbadians
9.2%
UNEMPLOYMENT AMONG WOMEN WITH CHILDREN AGES 6 TO 17 YEARS
8.2/ 100
METRIC RATING
213th/ 347
METRIC RANK
8.7%
UNEMPLOYMENT AMONG WOMEN WITH CHILDREN AGES 6 TO 17 YEARS
93.8/ 100
METRIC RATING
129th/ 347
METRIC RANK
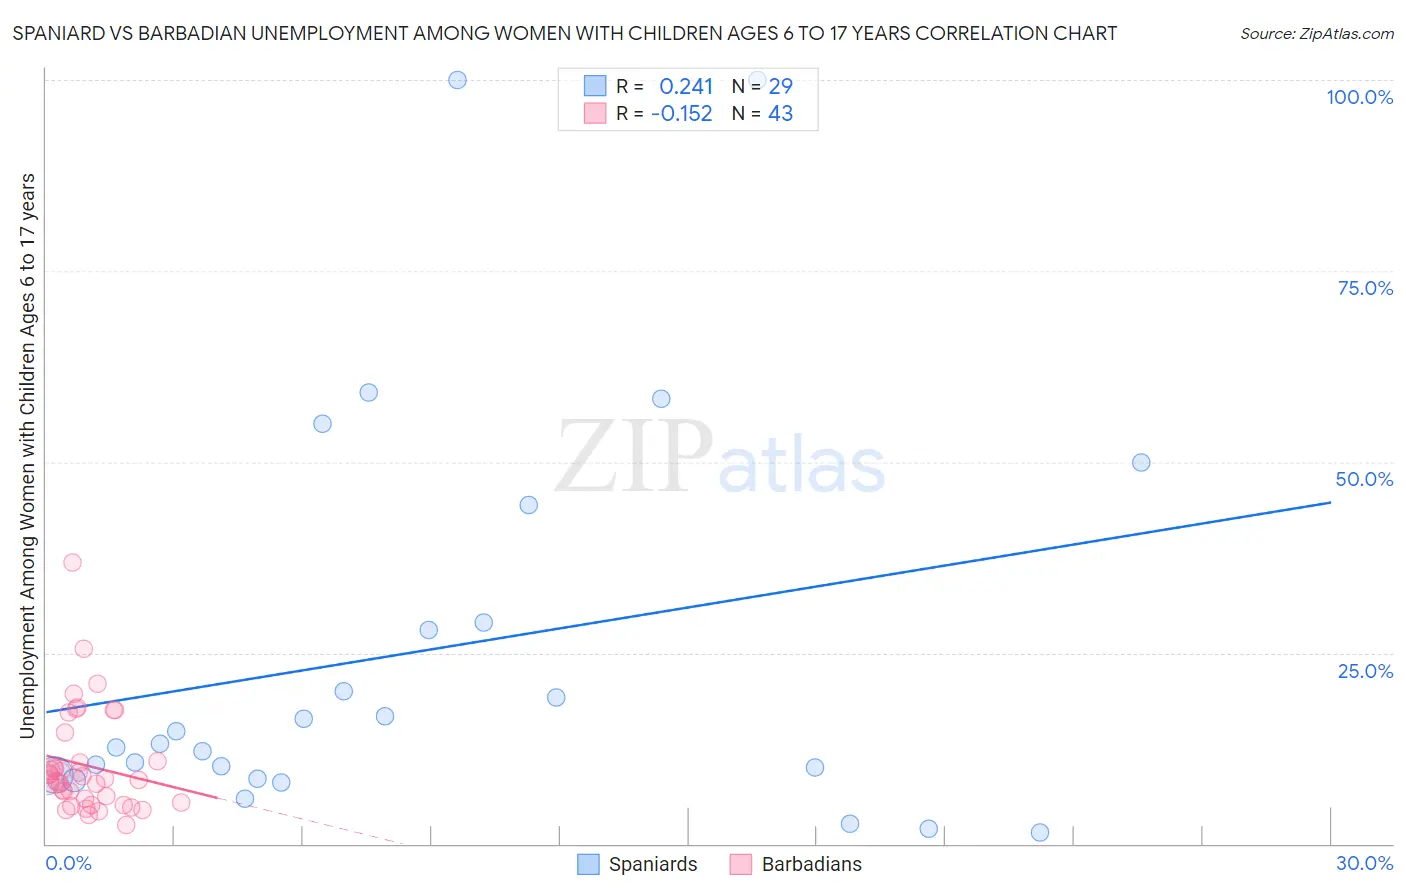
Spaniard vs Barbadian Unemployment Among Women with Children Ages 6 to 17 years Correlation Chart
The statistical analysis conducted on geographies consisting of 311,847,590 people shows a weak positive correlation between the proportion of Spaniards and unemployment rate among women with children between the ages 6 and 17 in the United States with a correlation coefficient (R) of 0.241 and weighted average of 9.2%. Similarly, the statistical analysis conducted on geographies consisting of 121,323,299 people shows a poor negative correlation between the proportion of Barbadians and unemployment rate among women with children between the ages 6 and 17 in the United States with a correlation coefficient (R) of -0.152 and weighted average of 8.7%, a difference of 5.9%.
Unemployment Among Women with Children Ages 6 to 17 years Correlation Summary
| Measurement | Spaniard | Barbadian |
| Minimum | 1.4% | 2.4% |
| Maximum | 100.0% | 36.8% |
| Range | 98.6% | 34.4% |
| Mean | 25.4% | 10.2% |
| Median | 13.1% | 8.4% |
| Interquartile 25% (IQ1) | 8.7% | 5.4% |
| Interquartile 75% (IQ3) | 36.7% | 10.8% |
| Interquartile Range (IQR) | 27.9% | 5.4% |
| Standard Deviation (Sample) | 26.8% | 6.7% |
| Standard Deviation (Population) | 26.3% | 6.7% |
Similar Demographics by Unemployment Among Women with Children Ages 6 to 17 years
Demographics Similar to Spaniards by Unemployment Among Women with Children Ages 6 to 17 years
In terms of unemployment among women with children ages 6 to 17 years, the demographic groups most similar to Spaniards are Iroquois (9.2%, a difference of 0.10%), Peruvian (9.2%, a difference of 0.11%), Immigrants from Germany (9.2%, a difference of 0.14%), Immigrants from Uruguay (9.2%, a difference of 0.14%), and German (9.2%, a difference of 0.15%).
| Demographics | Rating | Rank | Unemployment Among Women with Children Ages 6 to 17 years |
| Immigrants | North America | 12.7 /100 | #206 | Poor 9.2% |
| Cubans | 10.9 /100 | #207 | Poor 9.2% |
| Immigrants | Peru | 10.8 /100 | #208 | Poor 9.2% |
| Salvadorans | 10.7 /100 | #209 | Poor 9.2% |
| Finns | 10.0 /100 | #210 | Tragic 9.2% |
| Immigrants | Cuba | 9.6 /100 | #211 | Tragic 9.2% |
| Peruvians | 9.0 /100 | #212 | Tragic 9.2% |
| Spaniards | 8.2 /100 | #213 | Tragic 9.2% |
| Iroquois | 7.5 /100 | #214 | Tragic 9.2% |
| Immigrants | Germany | 7.2 /100 | #215 | Tragic 9.2% |
| Immigrants | Uruguay | 7.2 /100 | #216 | Tragic 9.2% |
| Germans | 7.2 /100 | #217 | Tragic 9.2% |
| Syrians | 6.9 /100 | #218 | Tragic 9.2% |
| Immigrants | Scotland | 6.6 /100 | #219 | Tragic 9.2% |
| Belgians | 6.4 /100 | #220 | Tragic 9.2% |
Demographics Similar to Barbadians by Unemployment Among Women with Children Ages 6 to 17 years
In terms of unemployment among women with children ages 6 to 17 years, the demographic groups most similar to Barbadians are Hmong (8.7%, a difference of 0.10%), Immigrants from Northern Africa (8.7%, a difference of 0.12%), Czech (8.7%, a difference of 0.12%), Immigrants from Western Asia (8.7%, a difference of 0.14%), and South African (8.7%, a difference of 0.15%).
| Demographics | Rating | Rank | Unemployment Among Women with Children Ages 6 to 17 years |
| Immigrants | Egypt | 95.0 /100 | #122 | Exceptional 8.7% |
| Immigrants | Morocco | 94.9 /100 | #123 | Exceptional 8.7% |
| Immigrants | Lebanon | 94.9 /100 | #124 | Exceptional 8.7% |
| South Africans | 94.6 /100 | #125 | Exceptional 8.7% |
| Immigrants | Northern Africa | 94.4 /100 | #126 | Exceptional 8.7% |
| Czechs | 94.4 /100 | #127 | Exceptional 8.7% |
| Hmong | 94.3 /100 | #128 | Exceptional 8.7% |
| Barbadians | 93.8 /100 | #129 | Exceptional 8.7% |
| Immigrants | Western Asia | 93.1 /100 | #130 | Exceptional 8.7% |
| Slavs | 92.2 /100 | #131 | Exceptional 8.7% |
| Yaqui | 92.2 /100 | #132 | Exceptional 8.7% |
| Egyptians | 91.8 /100 | #133 | Exceptional 8.7% |
| Immigrants | Ireland | 91.0 /100 | #134 | Exceptional 8.7% |
| Europeans | 90.6 /100 | #135 | Exceptional 8.7% |
| Immigrants | Latvia | 90.4 /100 | #136 | Exceptional 8.7% |