Somali vs New Zealander Male Poverty
COMPARE
Somali
New Zealander
Male Poverty
Male Poverty Comparison
Somalis
New Zealanders
14.3%
MALE POVERTY
0.0/ 100
METRIC RATING
309th/ 347
METRIC RANK
10.8%
MALE POVERTY
82.9/ 100
METRIC RATING
134th/ 347
METRIC RANK
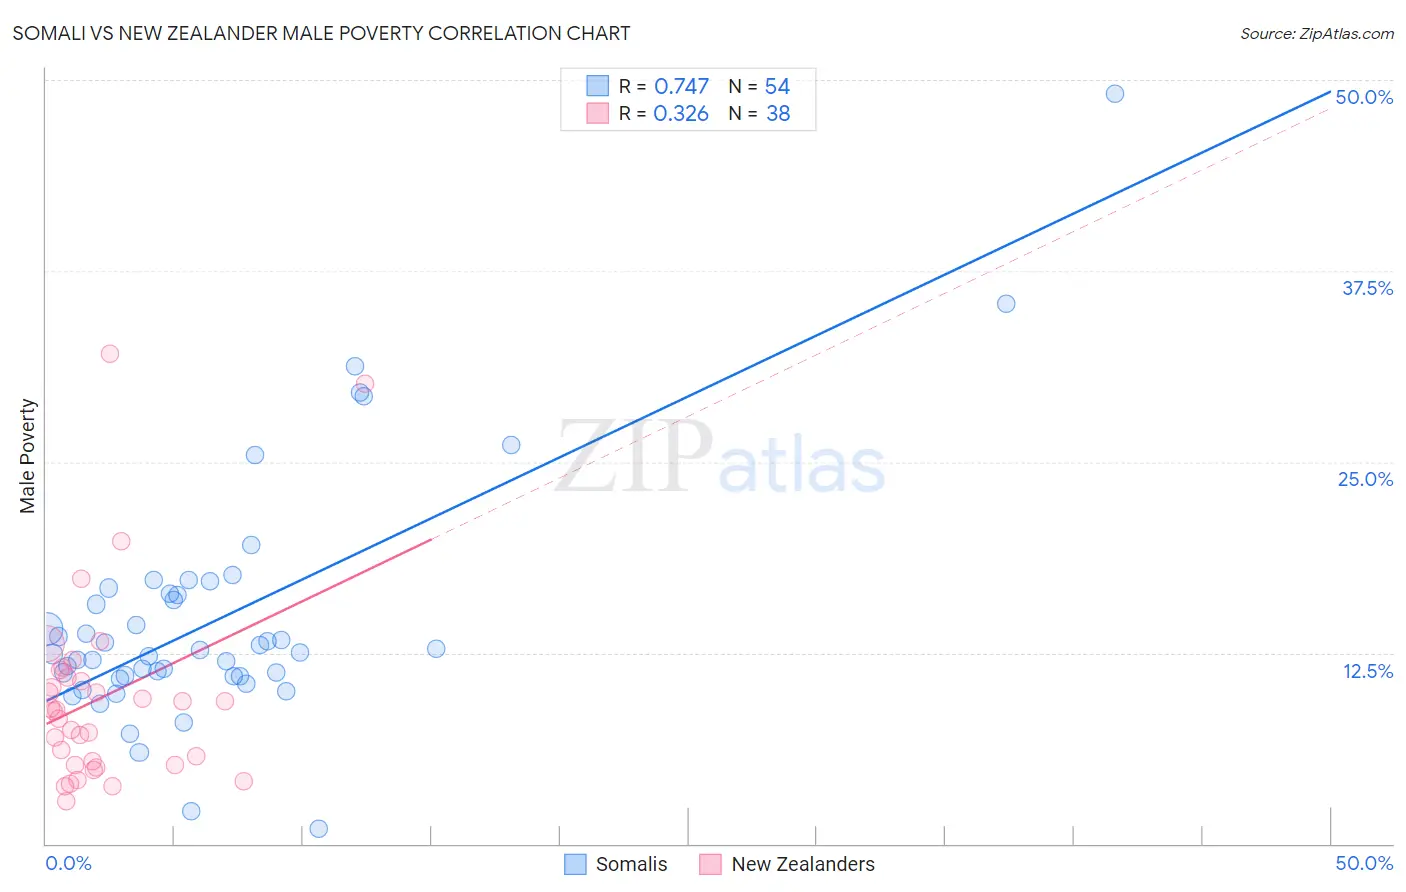
Somali vs New Zealander Male Poverty Correlation Chart
The statistical analysis conducted on geographies consisting of 99,289,063 people shows a strong positive correlation between the proportion of Somalis and poverty level among males in the United States with a correlation coefficient (R) of 0.747 and weighted average of 14.3%. Similarly, the statistical analysis conducted on geographies consisting of 106,891,318 people shows a mild positive correlation between the proportion of New Zealanders and poverty level among males in the United States with a correlation coefficient (R) of 0.326 and weighted average of 10.8%, a difference of 32.6%.
Male Poverty Correlation Summary
| Measurement | Somali | New Zealander |
| Minimum | 1.0% | 2.8% |
| Maximum | 49.1% | 32.1% |
| Range | 48.1% | 29.3% |
| Mean | 14.8% | 9.6% |
| Median | 12.6% | 8.7% |
| Interquartile 25% (IQ1) | 10.9% | 5.1% |
| Interquartile 75% (IQ3) | 16.4% | 10.9% |
| Interquartile Range (IQR) | 5.4% | 5.7% |
| Standard Deviation (Sample) | 8.1% | 6.4% |
| Standard Deviation (Population) | 8.0% | 6.3% |
Similar Demographics by Male Poverty
Demographics Similar to Somalis by Male Poverty
In terms of male poverty, the demographic groups most similar to Somalis are Seminole (14.3%, a difference of 0.20%), African (14.2%, a difference of 0.38%), Dutch West Indian (14.2%, a difference of 0.40%), Honduran (14.3%, a difference of 0.41%), and Choctaw (14.4%, a difference of 0.88%).
| Demographics | Rating | Rank | Male Poverty |
| Immigrants | Caribbean | 0.0 /100 | #302 | Tragic 14.0% |
| Bahamians | 0.0 /100 | #303 | Tragic 14.1% |
| Senegalese | 0.0 /100 | #304 | Tragic 14.1% |
| Immigrants | Bangladesh | 0.0 /100 | #305 | Tragic 14.1% |
| Creek | 0.0 /100 | #306 | Tragic 14.1% |
| Dutch West Indians | 0.0 /100 | #307 | Tragic 14.2% |
| Africans | 0.0 /100 | #308 | Tragic 14.2% |
| Somalis | 0.0 /100 | #309 | Tragic 14.3% |
| Seminole | 0.0 /100 | #310 | Tragic 14.3% |
| Hondurans | 0.0 /100 | #311 | Tragic 14.3% |
| Choctaw | 0.0 /100 | #312 | Tragic 14.4% |
| Immigrants | Somalia | 0.0 /100 | #313 | Tragic 14.6% |
| Immigrants | Honduras | 0.0 /100 | #314 | Tragic 14.6% |
| Chippewa | 0.0 /100 | #315 | Tragic 14.6% |
| British West Indians | 0.0 /100 | #316 | Tragic 14.6% |
Demographics Similar to New Zealanders by Male Poverty
In terms of male poverty, the demographic groups most similar to New Zealanders are Pakistani (10.8%, a difference of 0.010%), Immigrants from Vietnam (10.8%, a difference of 0.020%), Brazilian (10.8%, a difference of 0.040%), Immigrants from Belarus (10.7%, a difference of 0.070%), and Chilean (10.7%, a difference of 0.18%).
| Demographics | Rating | Rank | Male Poverty |
| Puget Sound Salish | 84.3 /100 | #127 | Excellent 10.7% |
| Immigrants | Western Europe | 84.2 /100 | #128 | Excellent 10.7% |
| Immigrants | Peru | 84.1 /100 | #129 | Excellent 10.7% |
| Chileans | 83.9 /100 | #130 | Excellent 10.7% |
| Immigrants | Belarus | 83.3 /100 | #131 | Excellent 10.7% |
| Immigrants | Vietnam | 83.0 /100 | #132 | Excellent 10.8% |
| Pakistanis | 83.0 /100 | #133 | Excellent 10.8% |
| New Zealanders | 82.9 /100 | #134 | Excellent 10.8% |
| Brazilians | 82.7 /100 | #135 | Excellent 10.8% |
| Immigrants | Israel | 80.9 /100 | #136 | Excellent 10.8% |
| Immigrants | Switzerland | 79.2 /100 | #137 | Good 10.8% |
| Yugoslavians | 78.2 /100 | #138 | Good 10.8% |
| Immigrants | Jordan | 77.5 /100 | #139 | Good 10.8% |
| Tlingit-Haida | 76.1 /100 | #140 | Good 10.9% |
| Immigrants | France | 75.8 /100 | #141 | Good 10.9% |