Immigrants from Saudi Arabia vs New Zealander Male Poverty
COMPARE
Immigrants from Saudi Arabia
New Zealander
Male Poverty
Male Poverty Comparison
Immigrants from Saudi Arabia
New Zealanders
12.7%
MALE POVERTY
0.4/ 100
METRIC RATING
236th/ 347
METRIC RANK
10.8%
MALE POVERTY
82.9/ 100
METRIC RATING
134th/ 347
METRIC RANK
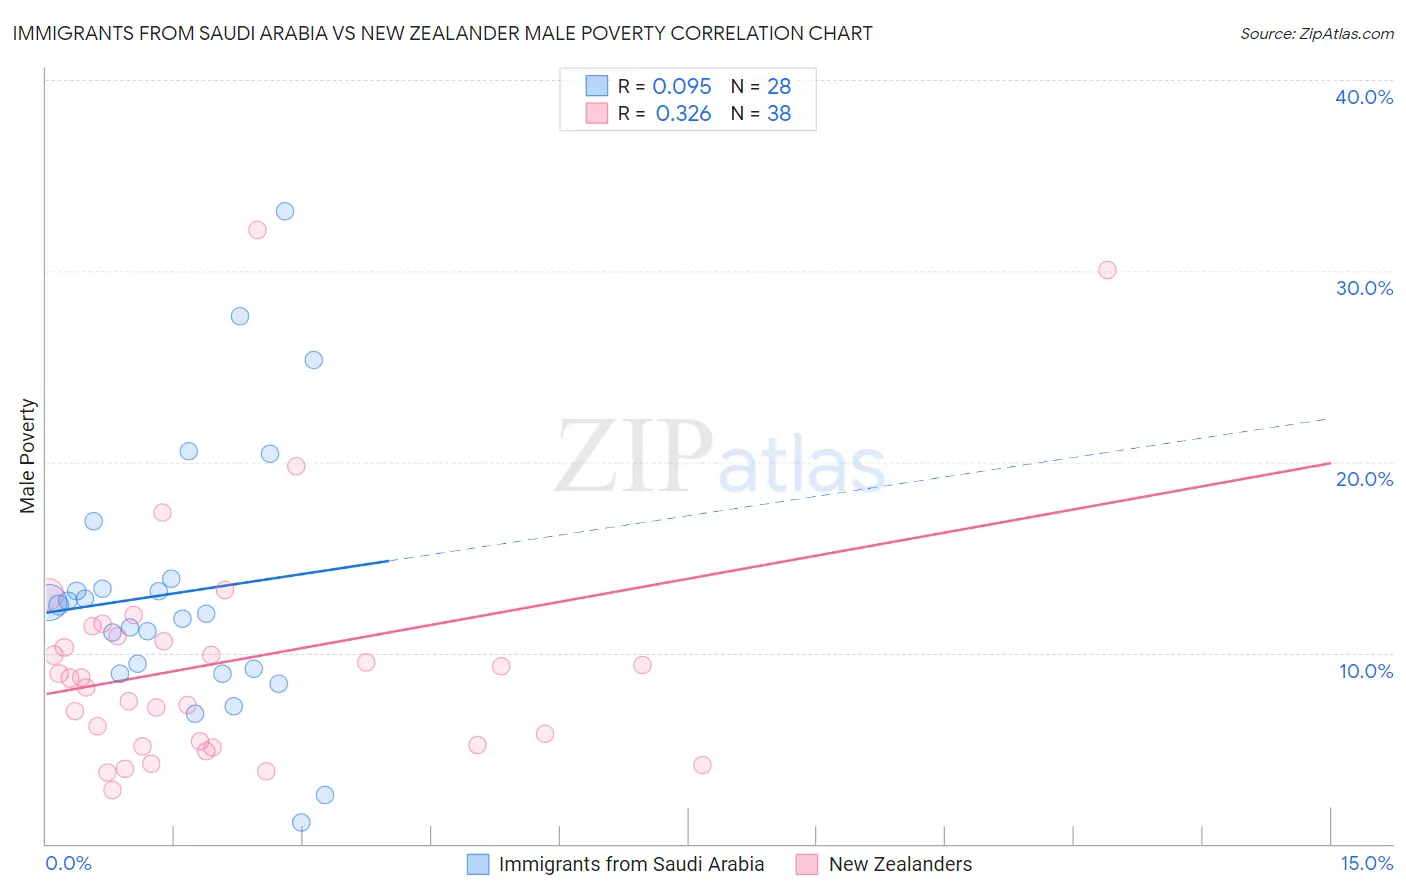
Immigrants from Saudi Arabia vs New Zealander Male Poverty Correlation Chart
The statistical analysis conducted on geographies consisting of 164,207,457 people shows a slight positive correlation between the proportion of Immigrants from Saudi Arabia and poverty level among males in the United States with a correlation coefficient (R) of 0.095 and weighted average of 12.7%. Similarly, the statistical analysis conducted on geographies consisting of 106,891,318 people shows a mild positive correlation between the proportion of New Zealanders and poverty level among males in the United States with a correlation coefficient (R) of 0.326 and weighted average of 10.8%, a difference of 17.8%.
Male Poverty Correlation Summary
| Measurement | Immigrants from Saudi Arabia | New Zealander |
| Minimum | 1.1% | 2.8% |
| Maximum | 33.1% | 32.1% |
| Range | 32.0% | 29.3% |
| Mean | 13.2% | 9.6% |
| Median | 12.3% | 8.7% |
| Interquartile 25% (IQ1) | 9.1% | 5.1% |
| Interquartile 75% (IQ3) | 13.6% | 10.9% |
| Interquartile Range (IQR) | 4.5% | 5.7% |
| Standard Deviation (Sample) | 7.0% | 6.4% |
| Standard Deviation (Population) | 6.9% | 6.3% |
Similar Demographics by Male Poverty
Demographics Similar to Immigrants from Saudi Arabia by Male Poverty
In terms of male poverty, the demographic groups most similar to Immigrants from Saudi Arabia are French American Indian (12.7%, a difference of 0.050%), Ecuadorian (12.7%, a difference of 0.080%), Ghanaian (12.7%, a difference of 0.080%), Immigrants from Laos (12.6%, a difference of 0.25%), and Immigrants from Middle Africa (12.7%, a difference of 0.35%).
| Demographics | Rating | Rank | Male Poverty |
| Cubans | 1.3 /100 | #229 | Tragic 12.4% |
| Marshallese | 0.8 /100 | #230 | Tragic 12.5% |
| Salvadorans | 0.6 /100 | #231 | Tragic 12.6% |
| Nicaraguans | 0.6 /100 | #232 | Tragic 12.6% |
| Fijians | 0.6 /100 | #233 | Tragic 12.6% |
| Immigrants | Armenia | 0.6 /100 | #234 | Tragic 12.6% |
| Immigrants | Laos | 0.5 /100 | #235 | Tragic 12.6% |
| Immigrants | Saudi Arabia | 0.4 /100 | #236 | Tragic 12.7% |
| French American Indians | 0.4 /100 | #237 | Tragic 12.7% |
| Ecuadorians | 0.4 /100 | #238 | Tragic 12.7% |
| Ghanaians | 0.4 /100 | #239 | Tragic 12.7% |
| Immigrants | Middle Africa | 0.4 /100 | #240 | Tragic 12.7% |
| Sudanese | 0.3 /100 | #241 | Tragic 12.8% |
| Nepalese | 0.3 /100 | #242 | Tragic 12.8% |
| Alaskan Athabascans | 0.3 /100 | #243 | Tragic 12.8% |
Demographics Similar to New Zealanders by Male Poverty
In terms of male poverty, the demographic groups most similar to New Zealanders are Pakistani (10.8%, a difference of 0.010%), Immigrants from Vietnam (10.8%, a difference of 0.020%), Brazilian (10.8%, a difference of 0.040%), Immigrants from Belarus (10.7%, a difference of 0.070%), and Chilean (10.7%, a difference of 0.18%).
| Demographics | Rating | Rank | Male Poverty |
| Puget Sound Salish | 84.3 /100 | #127 | Excellent 10.7% |
| Immigrants | Western Europe | 84.2 /100 | #128 | Excellent 10.7% |
| Immigrants | Peru | 84.1 /100 | #129 | Excellent 10.7% |
| Chileans | 83.9 /100 | #130 | Excellent 10.7% |
| Immigrants | Belarus | 83.3 /100 | #131 | Excellent 10.7% |
| Immigrants | Vietnam | 83.0 /100 | #132 | Excellent 10.8% |
| Pakistanis | 83.0 /100 | #133 | Excellent 10.8% |
| New Zealanders | 82.9 /100 | #134 | Excellent 10.8% |
| Brazilians | 82.7 /100 | #135 | Excellent 10.8% |
| Immigrants | Israel | 80.9 /100 | #136 | Excellent 10.8% |
| Immigrants | Switzerland | 79.2 /100 | #137 | Good 10.8% |
| Yugoslavians | 78.2 /100 | #138 | Good 10.8% |
| Immigrants | Jordan | 77.5 /100 | #139 | Good 10.8% |
| Tlingit-Haida | 76.1 /100 | #140 | Good 10.9% |
| Immigrants | France | 75.8 /100 | #141 | Good 10.9% |