Somali vs Immigrants from Kenya Male Poverty
COMPARE
Somali
Immigrants from Kenya
Male Poverty
Male Poverty Comparison
Somalis
Immigrants from Kenya
14.3%
MALE POVERTY
0.0/ 100
METRIC RATING
309th/ 347
METRIC RANK
11.6%
MALE POVERTY
16.1/ 100
METRIC RATING
194th/ 347
METRIC RANK
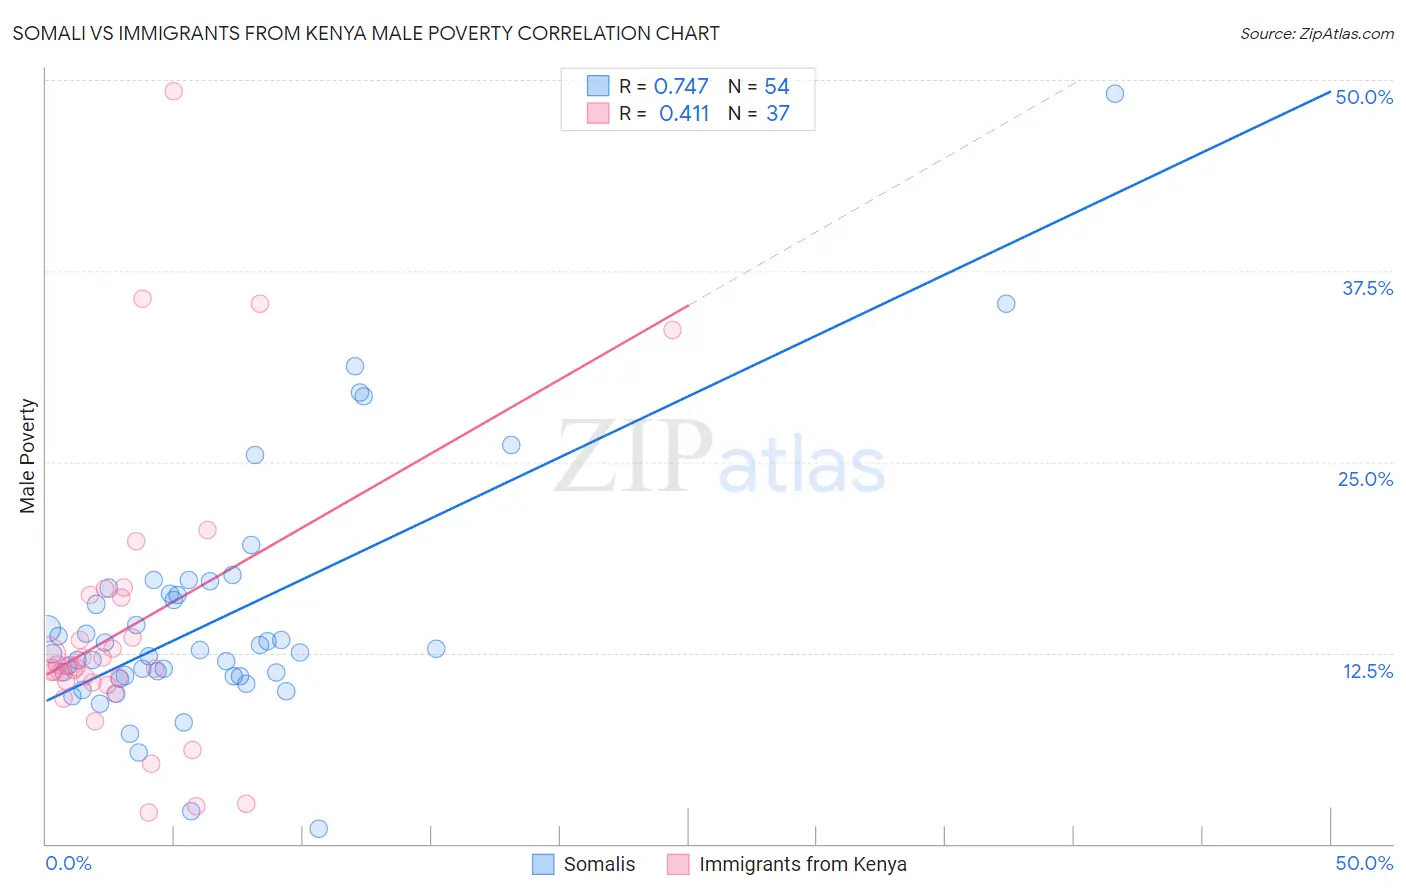
Somali vs Immigrants from Kenya Male Poverty Correlation Chart
The statistical analysis conducted on geographies consisting of 99,289,063 people shows a strong positive correlation between the proportion of Somalis and poverty level among males in the United States with a correlation coefficient (R) of 0.747 and weighted average of 14.3%. Similarly, the statistical analysis conducted on geographies consisting of 217,973,152 people shows a moderate positive correlation between the proportion of Immigrants from Kenya and poverty level among males in the United States with a correlation coefficient (R) of 0.411 and weighted average of 11.6%, a difference of 22.5%.
Male Poverty Correlation Summary
| Measurement | Somali | Immigrants from Kenya |
| Minimum | 1.0% | 2.1% |
| Maximum | 49.1% | 49.2% |
| Range | 48.1% | 47.2% |
| Mean | 14.8% | 14.3% |
| Median | 12.6% | 11.5% |
| Interquartile 25% (IQ1) | 10.9% | 10.5% |
| Interquartile 75% (IQ3) | 16.4% | 16.2% |
| Interquartile Range (IQR) | 5.4% | 5.7% |
| Standard Deviation (Sample) | 8.1% | 9.7% |
| Standard Deviation (Population) | 8.0% | 9.6% |
Similar Demographics by Male Poverty
Demographics Similar to Somalis by Male Poverty
In terms of male poverty, the demographic groups most similar to Somalis are Seminole (14.3%, a difference of 0.20%), African (14.2%, a difference of 0.38%), Dutch West Indian (14.2%, a difference of 0.40%), Honduran (14.3%, a difference of 0.41%), and Choctaw (14.4%, a difference of 0.88%).
| Demographics | Rating | Rank | Male Poverty |
| Immigrants | Caribbean | 0.0 /100 | #302 | Tragic 14.0% |
| Bahamians | 0.0 /100 | #303 | Tragic 14.1% |
| Senegalese | 0.0 /100 | #304 | Tragic 14.1% |
| Immigrants | Bangladesh | 0.0 /100 | #305 | Tragic 14.1% |
| Creek | 0.0 /100 | #306 | Tragic 14.1% |
| Dutch West Indians | 0.0 /100 | #307 | Tragic 14.2% |
| Africans | 0.0 /100 | #308 | Tragic 14.2% |
| Somalis | 0.0 /100 | #309 | Tragic 14.3% |
| Seminole | 0.0 /100 | #310 | Tragic 14.3% |
| Hondurans | 0.0 /100 | #311 | Tragic 14.3% |
| Choctaw | 0.0 /100 | #312 | Tragic 14.4% |
| Immigrants | Somalia | 0.0 /100 | #313 | Tragic 14.6% |
| Immigrants | Honduras | 0.0 /100 | #314 | Tragic 14.6% |
| Chippewa | 0.0 /100 | #315 | Tragic 14.6% |
| British West Indians | 0.0 /100 | #316 | Tragic 14.6% |
Demographics Similar to Immigrants from Kenya by Male Poverty
In terms of male poverty, the demographic groups most similar to Immigrants from Kenya are Arab (11.6%, a difference of 0.050%), Hmong (11.6%, a difference of 0.050%), Delaware (11.7%, a difference of 0.12%), Immigrants from Kuwait (11.6%, a difference of 0.21%), and Iraqi (11.7%, a difference of 0.25%).
| Demographics | Rating | Rank | Male Poverty |
| Immigrants | Iraq | 31.9 /100 | #187 | Fair 11.4% |
| Sierra Leoneans | 29.9 /100 | #188 | Fair 11.4% |
| Hawaiians | 28.3 /100 | #189 | Fair 11.4% |
| Israelis | 26.1 /100 | #190 | Fair 11.5% |
| South American Indians | 22.8 /100 | #191 | Fair 11.5% |
| Immigrants | Uruguay | 19.1 /100 | #192 | Poor 11.6% |
| Immigrants | Kuwait | 17.3 /100 | #193 | Poor 11.6% |
| Immigrants | Kenya | 16.1 /100 | #194 | Poor 11.6% |
| Arabs | 15.8 /100 | #195 | Poor 11.6% |
| Hmong | 15.8 /100 | #196 | Poor 11.6% |
| Delaware | 15.4 /100 | #197 | Poor 11.7% |
| Iraqis | 14.7 /100 | #198 | Poor 11.7% |
| Spanish | 14.1 /100 | #199 | Poor 11.7% |
| Immigrants | Lebanon | 13.6 /100 | #200 | Poor 11.7% |
| Spaniards | 13.5 /100 | #201 | Poor 11.7% |