Immigrants from Kazakhstan vs New Zealander Male Poverty
COMPARE
Immigrants from Kazakhstan
New Zealander
Male Poverty
Male Poverty Comparison
Immigrants from Kazakhstan
New Zealanders
11.0%
MALE POVERTY
64.8/ 100
METRIC RATING
154th/ 347
METRIC RANK
10.8%
MALE POVERTY
82.9/ 100
METRIC RATING
134th/ 347
METRIC RANK
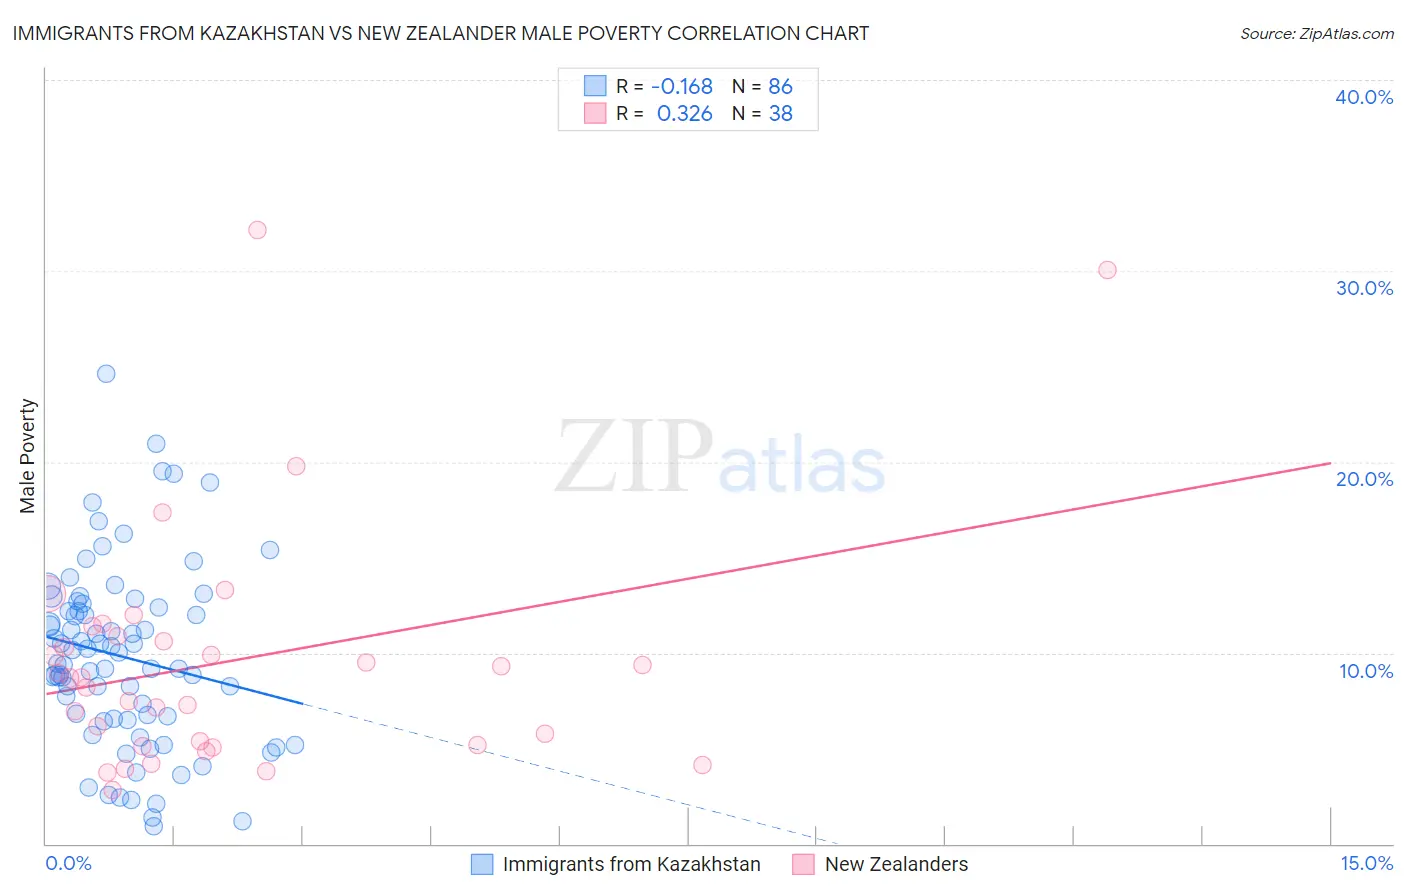
Immigrants from Kazakhstan vs New Zealander Male Poverty Correlation Chart
The statistical analysis conducted on geographies consisting of 124,423,008 people shows a poor negative correlation between the proportion of Immigrants from Kazakhstan and poverty level among males in the United States with a correlation coefficient (R) of -0.168 and weighted average of 11.0%. Similarly, the statistical analysis conducted on geographies consisting of 106,891,318 people shows a mild positive correlation between the proportion of New Zealanders and poverty level among males in the United States with a correlation coefficient (R) of 0.326 and weighted average of 10.8%, a difference of 2.5%.
Male Poverty Correlation Summary
| Measurement | Immigrants from Kazakhstan | New Zealander |
| Minimum | 0.92% | 2.8% |
| Maximum | 24.6% | 32.1% |
| Range | 23.7% | 29.3% |
| Mean | 9.8% | 9.6% |
| Median | 9.7% | 8.7% |
| Interquartile 25% (IQ1) | 6.5% | 5.1% |
| Interquartile 75% (IQ3) | 12.4% | 10.9% |
| Interquartile Range (IQR) | 5.9% | 5.7% |
| Standard Deviation (Sample) | 4.7% | 6.4% |
| Standard Deviation (Population) | 4.7% | 6.3% |
Demographics Similar to Immigrants from Kazakhstan and New Zealanders by Male Poverty
In terms of male poverty, the demographic groups most similar to Immigrants from Kazakhstan are Immigrants from Bosnia and Herzegovina (11.0%, a difference of 0.050%), Venezuelan (11.0%, a difference of 0.28%), Immigrants from Nepal (11.0%, a difference of 0.28%), Guamanian/Chamorro (11.0%, a difference of 0.31%), and Immigrants from Venezuela (11.0%, a difference of 0.35%). Similarly, the demographic groups most similar to New Zealanders are Brazilian (10.8%, a difference of 0.040%), Immigrants from Israel (10.8%, a difference of 0.35%), Immigrants from Switzerland (10.8%, a difference of 0.61%), Yugoslavian (10.8%, a difference of 0.77%), and Immigrants from Jordan (10.8%, a difference of 0.88%).
| Demographics | Rating | Rank | Male Poverty |
| New Zealanders | 82.9 /100 | #134 | Excellent 10.8% |
| Brazilians | 82.7 /100 | #135 | Excellent 10.8% |
| Immigrants | Israel | 80.9 /100 | #136 | Excellent 10.8% |
| Immigrants | Switzerland | 79.2 /100 | #137 | Good 10.8% |
| Yugoslavians | 78.2 /100 | #138 | Good 10.8% |
| Immigrants | Jordan | 77.5 /100 | #139 | Good 10.8% |
| Tlingit-Haida | 76.1 /100 | #140 | Good 10.9% |
| Immigrants | France | 75.8 /100 | #141 | Good 10.9% |
| Basques | 74.6 /100 | #142 | Good 10.9% |
| Afghans | 71.9 /100 | #143 | Good 10.9% |
| Samoans | 71.8 /100 | #144 | Good 10.9% |
| Immigrants | Germany | 71.6 /100 | #145 | Good 10.9% |
| Syrians | 71.4 /100 | #146 | Good 10.9% |
| Icelanders | 68.5 /100 | #147 | Good 11.0% |
| Armenians | 68.0 /100 | #148 | Good 11.0% |
| Immigrants | Venezuela | 67.9 /100 | #149 | Good 11.0% |
| Guamanians/Chamorros | 67.6 /100 | #150 | Good 11.0% |
| Venezuelans | 67.4 /100 | #151 | Good 11.0% |
| Immigrants | Nepal | 67.3 /100 | #152 | Good 11.0% |
| Immigrants | Bosnia and Herzegovina | 65.2 /100 | #153 | Good 11.0% |
| Immigrants | Kazakhstan | 64.8 /100 | #154 | Good 11.0% |