Somali vs Immigrants from Venezuela Male Poverty
COMPARE
Somali
Immigrants from Venezuela
Male Poverty
Male Poverty Comparison
Somalis
Immigrants from Venezuela
14.3%
MALE POVERTY
0.0/ 100
METRIC RATING
309th/ 347
METRIC RANK
11.0%
MALE POVERTY
67.9/ 100
METRIC RATING
149th/ 347
METRIC RANK
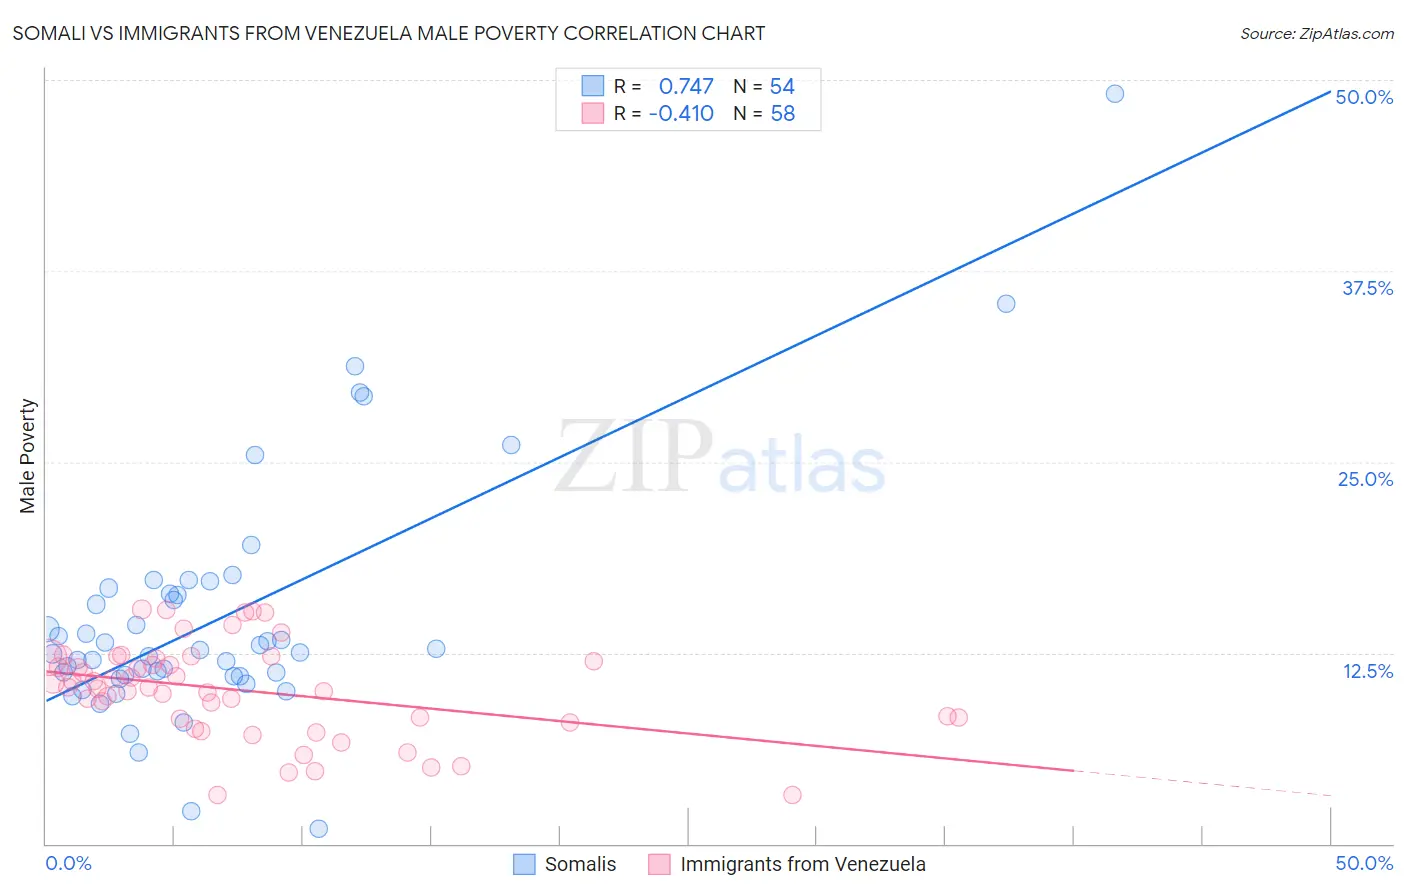
Somali vs Immigrants from Venezuela Male Poverty Correlation Chart
The statistical analysis conducted on geographies consisting of 99,289,063 people shows a strong positive correlation between the proportion of Somalis and poverty level among males in the United States with a correlation coefficient (R) of 0.747 and weighted average of 14.3%. Similarly, the statistical analysis conducted on geographies consisting of 287,626,289 people shows a moderate negative correlation between the proportion of Immigrants from Venezuela and poverty level among males in the United States with a correlation coefficient (R) of -0.410 and weighted average of 11.0%, a difference of 29.9%.
Male Poverty Correlation Summary
| Measurement | Somali | Immigrants from Venezuela |
| Minimum | 1.0% | 3.2% |
| Maximum | 49.1% | 15.3% |
| Range | 48.1% | 12.2% |
| Mean | 14.8% | 10.0% |
| Median | 12.6% | 10.2% |
| Interquartile 25% (IQ1) | 10.9% | 8.2% |
| Interquartile 75% (IQ3) | 16.4% | 12.1% |
| Interquartile Range (IQR) | 5.4% | 3.9% |
| Standard Deviation (Sample) | 8.1% | 3.1% |
| Standard Deviation (Population) | 8.0% | 3.0% |
Similar Demographics by Male Poverty
Demographics Similar to Somalis by Male Poverty
In terms of male poverty, the demographic groups most similar to Somalis are Seminole (14.3%, a difference of 0.20%), African (14.2%, a difference of 0.38%), Dutch West Indian (14.2%, a difference of 0.40%), Honduran (14.3%, a difference of 0.41%), and Choctaw (14.4%, a difference of 0.88%).
| Demographics | Rating | Rank | Male Poverty |
| Immigrants | Caribbean | 0.0 /100 | #302 | Tragic 14.0% |
| Bahamians | 0.0 /100 | #303 | Tragic 14.1% |
| Senegalese | 0.0 /100 | #304 | Tragic 14.1% |
| Immigrants | Bangladesh | 0.0 /100 | #305 | Tragic 14.1% |
| Creek | 0.0 /100 | #306 | Tragic 14.1% |
| Dutch West Indians | 0.0 /100 | #307 | Tragic 14.2% |
| Africans | 0.0 /100 | #308 | Tragic 14.2% |
| Somalis | 0.0 /100 | #309 | Tragic 14.3% |
| Seminole | 0.0 /100 | #310 | Tragic 14.3% |
| Hondurans | 0.0 /100 | #311 | Tragic 14.3% |
| Choctaw | 0.0 /100 | #312 | Tragic 14.4% |
| Immigrants | Somalia | 0.0 /100 | #313 | Tragic 14.6% |
| Immigrants | Honduras | 0.0 /100 | #314 | Tragic 14.6% |
| Chippewa | 0.0 /100 | #315 | Tragic 14.6% |
| British West Indians | 0.0 /100 | #316 | Tragic 14.6% |
Demographics Similar to Immigrants from Venezuela by Male Poverty
In terms of male poverty, the demographic groups most similar to Immigrants from Venezuela are Armenian (11.0%, a difference of 0.020%), Guamanian/Chamorro (11.0%, a difference of 0.040%), Venezuelan (11.0%, a difference of 0.060%), Icelander (11.0%, a difference of 0.070%), and Immigrants from Nepal (11.0%, a difference of 0.070%).
| Demographics | Rating | Rank | Male Poverty |
| Basques | 74.6 /100 | #142 | Good 10.9% |
| Afghans | 71.9 /100 | #143 | Good 10.9% |
| Samoans | 71.8 /100 | #144 | Good 10.9% |
| Immigrants | Germany | 71.6 /100 | #145 | Good 10.9% |
| Syrians | 71.4 /100 | #146 | Good 10.9% |
| Icelanders | 68.5 /100 | #147 | Good 11.0% |
| Armenians | 68.0 /100 | #148 | Good 11.0% |
| Immigrants | Venezuela | 67.9 /100 | #149 | Good 11.0% |
| Guamanians/Chamorros | 67.6 /100 | #150 | Good 11.0% |
| Venezuelans | 67.4 /100 | #151 | Good 11.0% |
| Immigrants | Nepal | 67.3 /100 | #152 | Good 11.0% |
| Immigrants | Bosnia and Herzegovina | 65.2 /100 | #153 | Good 11.0% |
| Immigrants | Kazakhstan | 64.8 /100 | #154 | Good 11.0% |
| Immigrants | Malaysia | 64.7 /100 | #155 | Good 11.0% |
| Costa Ricans | 63.9 /100 | #156 | Good 11.0% |