Immigrants from India vs New Zealander Male Poverty
COMPARE
Immigrants from India
New Zealander
Male Poverty
Male Poverty Comparison
Immigrants from India
New Zealanders
8.2%
MALE POVERTY
100.0/ 100
METRIC RATING
1st/ 347
METRIC RANK
10.8%
MALE POVERTY
82.9/ 100
METRIC RATING
134th/ 347
METRIC RANK
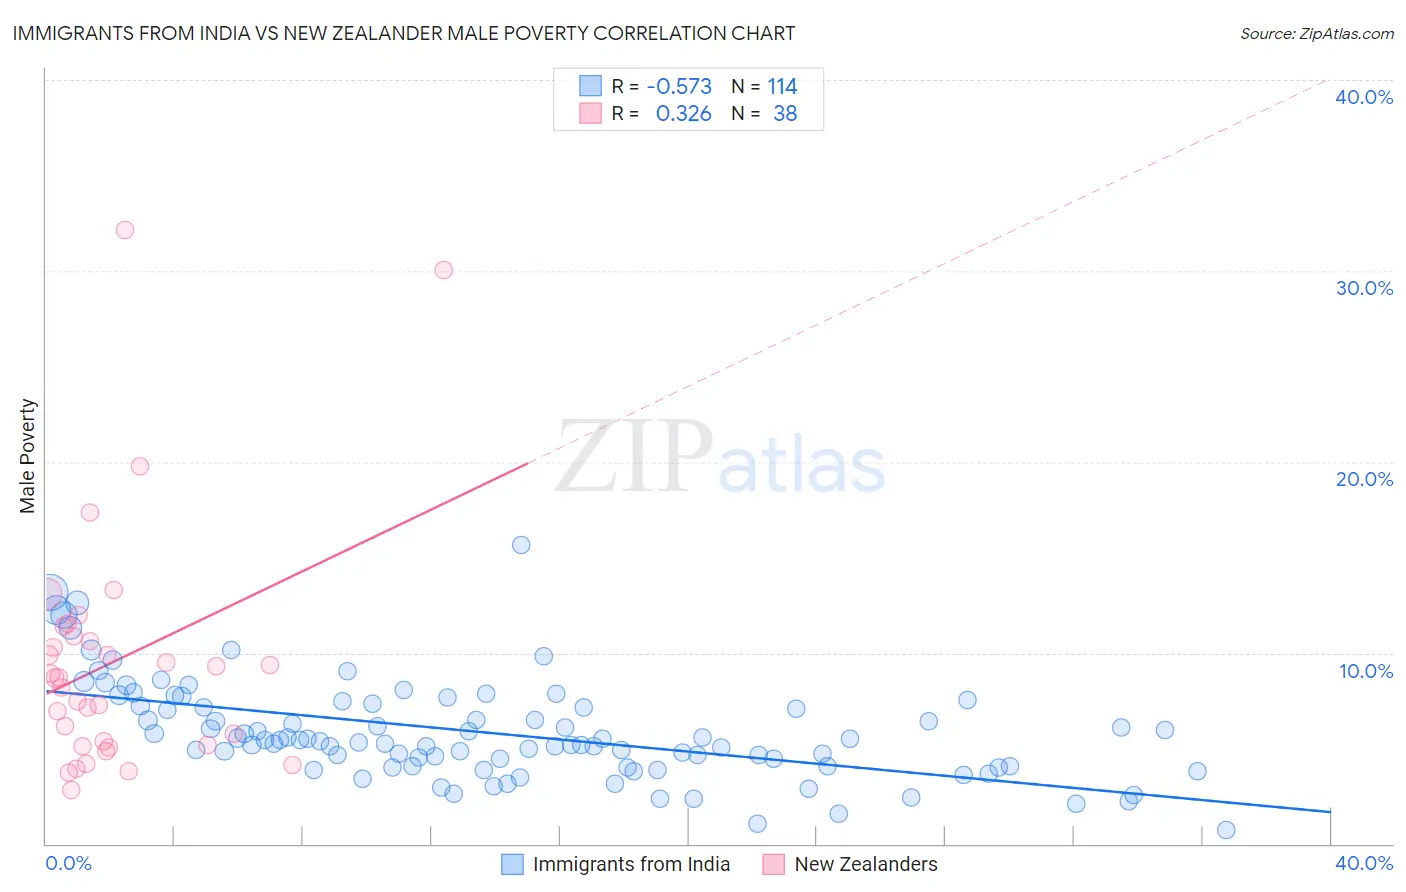
Immigrants from India vs New Zealander Male Poverty Correlation Chart
The statistical analysis conducted on geographies consisting of 433,533,379 people shows a substantial negative correlation between the proportion of Immigrants from India and poverty level among males in the United States with a correlation coefficient (R) of -0.573 and weighted average of 8.2%. Similarly, the statistical analysis conducted on geographies consisting of 106,891,318 people shows a mild positive correlation between the proportion of New Zealanders and poverty level among males in the United States with a correlation coefficient (R) of 0.326 and weighted average of 10.8%, a difference of 31.5%.
Male Poverty Correlation Summary
| Measurement | Immigrants from India | New Zealander |
| Minimum | 0.74% | 2.8% |
| Maximum | 15.6% | 32.1% |
| Range | 14.9% | 29.3% |
| Mean | 5.8% | 9.6% |
| Median | 5.4% | 8.7% |
| Interquartile 25% (IQ1) | 4.1% | 5.1% |
| Interquartile 75% (IQ3) | 7.2% | 10.9% |
| Interquartile Range (IQR) | 3.2% | 5.7% |
| Standard Deviation (Sample) | 2.6% | 6.4% |
| Standard Deviation (Population) | 2.6% | 6.3% |
Similar Demographics by Male Poverty
Demographics Similar to Immigrants from India by Male Poverty
In terms of male poverty, the demographic groups most similar to Immigrants from India are Chinese (8.7%, a difference of 6.2%), Thai (8.7%, a difference of 6.2%), Immigrants from Taiwan (8.9%, a difference of 8.7%), Maltese (9.1%, a difference of 10.9%), and Assyrian/Chaldean/Syriac (9.1%, a difference of 11.6%).
| Demographics | Rating | Rank | Male Poverty |
| Immigrants | India | 100.0 /100 | #1 | Exceptional 8.2% |
| Chinese | 100.0 /100 | #2 | Exceptional 8.7% |
| Thais | 100.0 /100 | #3 | Exceptional 8.7% |
| Immigrants | Taiwan | 100.0 /100 | #4 | Exceptional 8.9% |
| Maltese | 100.0 /100 | #5 | Exceptional 9.1% |
| Assyrians/Chaldeans/Syriacs | 99.9 /100 | #6 | Exceptional 9.1% |
| Immigrants | Ireland | 99.9 /100 | #7 | Exceptional 9.1% |
| Filipinos | 99.9 /100 | #8 | Exceptional 9.2% |
| Immigrants | South Central Asia | 99.9 /100 | #9 | Exceptional 9.3% |
| Bulgarians | 99.9 /100 | #10 | Exceptional 9.3% |
| Bolivians | 99.9 /100 | #11 | Exceptional 9.4% |
| Immigrants | Bolivia | 99.9 /100 | #12 | Exceptional 9.4% |
| Immigrants | Lithuania | 99.9 /100 | #13 | Exceptional 9.4% |
| Immigrants | North Macedonia | 99.8 /100 | #14 | Exceptional 9.4% |
| Bhutanese | 99.8 /100 | #15 | Exceptional 9.5% |
Demographics Similar to New Zealanders by Male Poverty
In terms of male poverty, the demographic groups most similar to New Zealanders are Pakistani (10.8%, a difference of 0.010%), Immigrants from Vietnam (10.8%, a difference of 0.020%), Brazilian (10.8%, a difference of 0.040%), Immigrants from Belarus (10.7%, a difference of 0.070%), and Chilean (10.7%, a difference of 0.18%).
| Demographics | Rating | Rank | Male Poverty |
| Puget Sound Salish | 84.3 /100 | #127 | Excellent 10.7% |
| Immigrants | Western Europe | 84.2 /100 | #128 | Excellent 10.7% |
| Immigrants | Peru | 84.1 /100 | #129 | Excellent 10.7% |
| Chileans | 83.9 /100 | #130 | Excellent 10.7% |
| Immigrants | Belarus | 83.3 /100 | #131 | Excellent 10.7% |
| Immigrants | Vietnam | 83.0 /100 | #132 | Excellent 10.8% |
| Pakistanis | 83.0 /100 | #133 | Excellent 10.8% |
| New Zealanders | 82.9 /100 | #134 | Excellent 10.8% |
| Brazilians | 82.7 /100 | #135 | Excellent 10.8% |
| Immigrants | Israel | 80.9 /100 | #136 | Excellent 10.8% |
| Immigrants | Switzerland | 79.2 /100 | #137 | Good 10.8% |
| Yugoslavians | 78.2 /100 | #138 | Good 10.8% |
| Immigrants | Jordan | 77.5 /100 | #139 | Good 10.8% |
| Tlingit-Haida | 76.1 /100 | #140 | Good 10.9% |
| Immigrants | France | 75.8 /100 | #141 | Good 10.9% |