Somali vs New Zealander Unemployment Among Women with Children Under 18 years
COMPARE
Somali
New Zealander
Unemployment Among Women with Children Under 18 years
Unemployment Among Women with Children Under 18 years Comparison
Somalis
New Zealanders
5.8%
UNEMPLOYMENT AMONG WOMEN WITH CHILDREN UNDER 18 YEARS
3.5/ 100
METRIC RATING
228th/ 347
METRIC RANK
5.3%
UNEMPLOYMENT AMONG WOMEN WITH CHILDREN UNDER 18 YEARS
79.9/ 100
METRIC RATING
135th/ 347
METRIC RANK
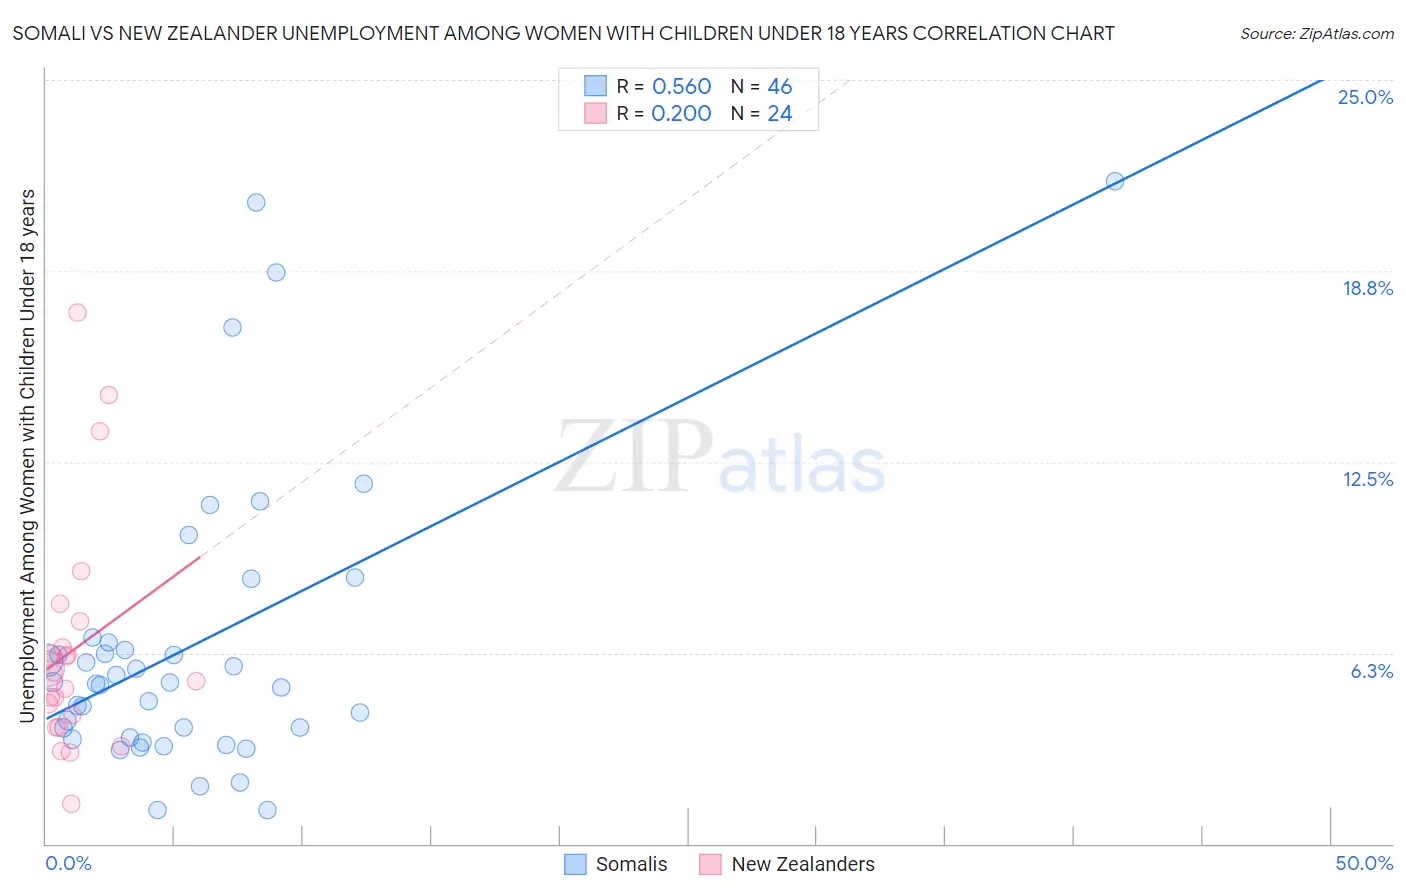
Somali vs New Zealander Unemployment Among Women with Children Under 18 years Correlation Chart
The statistical analysis conducted on geographies consisting of 97,989,792 people shows a substantial positive correlation between the proportion of Somalis and unemployment rate among women with children under the age of 18 in the United States with a correlation coefficient (R) of 0.560 and weighted average of 5.8%. Similarly, the statistical analysis conducted on geographies consisting of 105,222,940 people shows a weak positive correlation between the proportion of New Zealanders and unemployment rate among women with children under the age of 18 in the United States with a correlation coefficient (R) of 0.200 and weighted average of 5.3%, a difference of 8.5%.
Unemployment Among Women with Children Under 18 years Correlation Summary
| Measurement | Somali | New Zealander |
| Minimum | 1.1% | 1.3% |
| Maximum | 21.7% | 17.4% |
| Range | 20.6% | 16.1% |
| Mean | 6.5% | 6.4% |
| Median | 5.3% | 5.5% |
| Interquartile 25% (IQ1) | 3.5% | 4.0% |
| Interquartile 75% (IQ3) | 6.6% | 6.8% |
| Interquartile Range (IQR) | 3.1% | 2.8% |
| Standard Deviation (Sample) | 4.8% | 3.8% |
| Standard Deviation (Population) | 4.7% | 3.8% |
Similar Demographics by Unemployment Among Women with Children Under 18 years
Demographics Similar to Somalis by Unemployment Among Women with Children Under 18 years
In terms of unemployment among women with children under 18 years, the demographic groups most similar to Somalis are Immigrants from Panama (5.8%, a difference of 0.090%), Sierra Leonean (5.8%, a difference of 0.14%), Immigrants from South America (5.8%, a difference of 0.15%), Immigrants from Africa (5.8%, a difference of 0.21%), and Creek (5.8%, a difference of 0.24%).
| Demographics | Rating | Rank | Unemployment Among Women with Children Under 18 years |
| Pennsylvania Germans | 5.7 /100 | #221 | Tragic 5.7% |
| Osage | 5.0 /100 | #222 | Tragic 5.7% |
| Potawatomi | 5.0 /100 | #223 | Tragic 5.7% |
| Immigrants | Syria | 4.6 /100 | #224 | Tragic 5.7% |
| Armenians | 4.5 /100 | #225 | Tragic 5.7% |
| Cherokee | 4.3 /100 | #226 | Tragic 5.7% |
| Sierra Leoneans | 3.8 /100 | #227 | Tragic 5.8% |
| Somalis | 3.5 /100 | #228 | Tragic 5.8% |
| Immigrants | Panama | 3.4 /100 | #229 | Tragic 5.8% |
| Immigrants | South America | 3.2 /100 | #230 | Tragic 5.8% |
| Immigrants | Africa | 3.1 /100 | #231 | Tragic 5.8% |
| Creek | 3.1 /100 | #232 | Tragic 5.8% |
| Spanish Americans | 3.1 /100 | #233 | Tragic 5.8% |
| Guamanians/Chamorros | 2.9 /100 | #234 | Tragic 5.8% |
| Immigrants | Middle Africa | 2.8 /100 | #235 | Tragic 5.8% |
Demographics Similar to New Zealanders by Unemployment Among Women with Children Under 18 years
In terms of unemployment among women with children under 18 years, the demographic groups most similar to New Zealanders are Immigrants from Jordan (5.3%, a difference of 0.050%), Slovak (5.3%, a difference of 0.070%), Ethiopian (5.3%, a difference of 0.090%), Jordanian (5.3%, a difference of 0.12%), and Argentinean (5.3%, a difference of 0.13%).
| Demographics | Rating | Rank | Unemployment Among Women with Children Under 18 years |
| Immigrants | South Africa | 82.8 /100 | #128 | Excellent 5.3% |
| Immigrants | Italy | 82.3 /100 | #129 | Excellent 5.3% |
| Immigrants | Austria | 82.1 /100 | #130 | Excellent 5.3% |
| Immigrants | Israel | 81.9 /100 | #131 | Excellent 5.3% |
| Immigrants | Ethiopia | 81.4 /100 | #132 | Excellent 5.3% |
| Ethiopians | 80.7 /100 | #133 | Excellent 5.3% |
| Slovaks | 80.5 /100 | #134 | Excellent 5.3% |
| New Zealanders | 79.9 /100 | #135 | Good 5.3% |
| Immigrants | Jordan | 79.5 /100 | #136 | Good 5.3% |
| Jordanians | 78.8 /100 | #137 | Good 5.3% |
| Argentineans | 78.8 /100 | #138 | Good 5.3% |
| Immigrants | Ukraine | 78.5 /100 | #139 | Good 5.3% |
| Immigrants | Norway | 76.2 /100 | #140 | Good 5.3% |
| Venezuelans | 76.0 /100 | #141 | Good 5.3% |
| Immigrants | Venezuela | 75.4 /100 | #142 | Good 5.3% |