Cherokee vs Sierra Leonean Single Female Poverty
COMPARE
Cherokee
Sierra Leonean
Single Female Poverty
Single Female Poverty Comparison
Cherokee
Sierra Leoneans
25.7%
SINGLE FEMALE POVERTY
0.0/ 100
METRIC RATING
314th/ 347
METRIC RANK
19.7%
SINGLE FEMALE POVERTY
97.9/ 100
METRIC RATING
99th/ 347
METRIC RANK
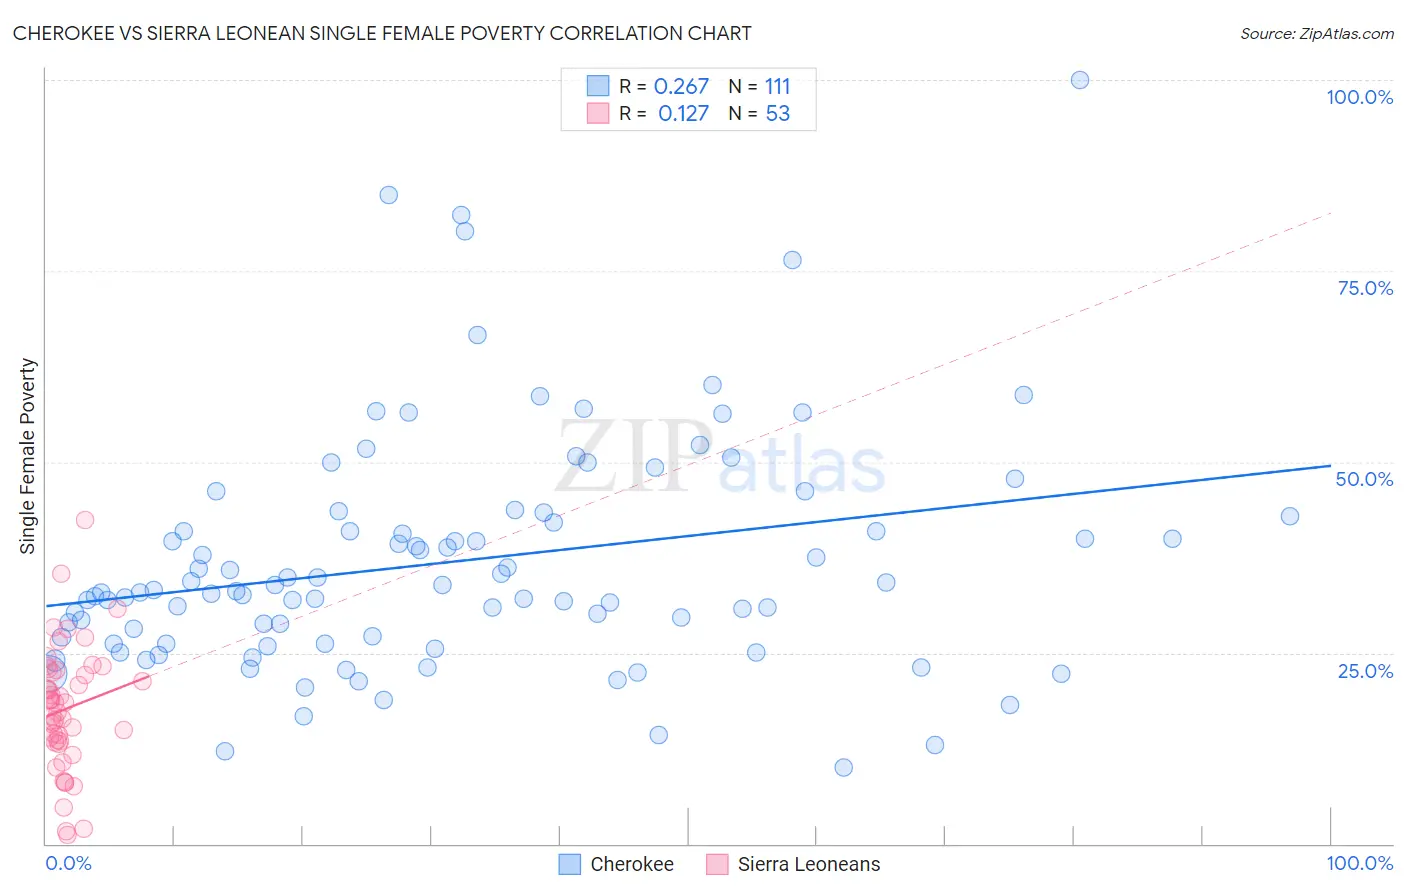
Cherokee vs Sierra Leonean Single Female Poverty Correlation Chart
The statistical analysis conducted on geographies consisting of 484,754,756 people shows a weak positive correlation between the proportion of Cherokee and poverty level among single females in the United States with a correlation coefficient (R) of 0.267 and weighted average of 25.7%. Similarly, the statistical analysis conducted on geographies consisting of 83,185,885 people shows a poor positive correlation between the proportion of Sierra Leoneans and poverty level among single females in the United States with a correlation coefficient (R) of 0.127 and weighted average of 19.7%, a difference of 29.9%.
Single Female Poverty Correlation Summary
| Measurement | Cherokee | Sierra Leonean |
| Minimum | 10.0% | 1.1% |
| Maximum | 100.0% | 42.4% |
| Range | 90.0% | 41.2% |
| Mean | 37.0% | 17.6% |
| Median | 33.1% | 18.6% |
| Interquartile 25% (IQ1) | 26.2% | 13.4% |
| Interquartile 75% (IQ3) | 42.9% | 22.5% |
| Interquartile Range (IQR) | 16.6% | 9.2% |
| Standard Deviation (Sample) | 15.5% | 8.1% |
| Standard Deviation (Population) | 15.4% | 8.0% |
Similar Demographics by Single Female Poverty
Demographics Similar to Cherokee by Single Female Poverty
In terms of single female poverty, the demographic groups most similar to Cherokee are Iroquois (25.7%, a difference of 0.32%), Comanche (25.6%, a difference of 0.36%), Paiute (25.5%, a difference of 0.47%), Immigrants from Somalia (25.8%, a difference of 0.47%), and Immigrants from Honduras (25.5%, a difference of 0.51%).
| Demographics | Rating | Rank | Single Female Poverty |
| Potawatomi | 0.0 /100 | #307 | Tragic 25.4% |
| Aleuts | 0.0 /100 | #308 | Tragic 25.4% |
| Dominicans | 0.0 /100 | #309 | Tragic 25.4% |
| Central American Indians | 0.0 /100 | #310 | Tragic 25.5% |
| Immigrants | Honduras | 0.0 /100 | #311 | Tragic 25.5% |
| Paiute | 0.0 /100 | #312 | Tragic 25.5% |
| Comanche | 0.0 /100 | #313 | Tragic 25.6% |
| Cherokee | 0.0 /100 | #314 | Tragic 25.7% |
| Iroquois | 0.0 /100 | #315 | Tragic 25.7% |
| Immigrants | Somalia | 0.0 /100 | #316 | Tragic 25.8% |
| Ottawa | 0.0 /100 | #317 | Tragic 26.0% |
| Chickasaw | 0.0 /100 | #318 | Tragic 26.3% |
| Blacks/African Americans | 0.0 /100 | #319 | Tragic 26.4% |
| Arapaho | 0.0 /100 | #320 | Tragic 26.4% |
| Yup'ik | 0.0 /100 | #321 | Tragic 26.6% |
Demographics Similar to Sierra Leoneans by Single Female Poverty
In terms of single female poverty, the demographic groups most similar to Sierra Leoneans are Immigrants from France (19.7%, a difference of 0.010%), Croatian (19.7%, a difference of 0.14%), Immigrants from Brazil (19.7%, a difference of 0.23%), Ukrainian (19.8%, a difference of 0.25%), and Estonian (19.7%, a difference of 0.28%).
| Demographics | Rating | Rank | Single Female Poverty |
| Italians | 98.8 /100 | #92 | Exceptional 19.6% |
| Immigrants | Austria | 98.8 /100 | #93 | Exceptional 19.6% |
| Romanians | 98.6 /100 | #94 | Exceptional 19.6% |
| Estonians | 98.2 /100 | #95 | Exceptional 19.7% |
| Immigrants | Brazil | 98.2 /100 | #96 | Exceptional 19.7% |
| Croatians | 98.1 /100 | #97 | Exceptional 19.7% |
| Immigrants | France | 97.9 /100 | #98 | Exceptional 19.7% |
| Sierra Leoneans | 97.9 /100 | #99 | Exceptional 19.7% |
| Ukrainians | 97.6 /100 | #100 | Exceptional 19.8% |
| Immigrants | Belgium | 97.3 /100 | #101 | Exceptional 19.8% |
| Immigrants | Cameroon | 97.3 /100 | #102 | Exceptional 19.8% |
| Immigrants | Southern Europe | 97.1 /100 | #103 | Exceptional 19.9% |
| Chileans | 96.9 /100 | #104 | Exceptional 19.9% |
| Israelis | 96.9 /100 | #105 | Exceptional 19.9% |
| Ethiopians | 96.7 /100 | #106 | Exceptional 19.9% |